

Question: Descriptive and Visualizing Data Using R Studio Based on the given set of data, complete the following tasks. Given data set: *Employee data.csv data 1.
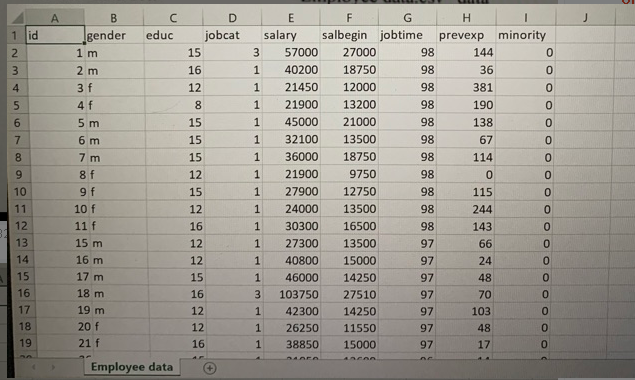
Descriptive and Visualizing Data Using R Studio Based on the given set of data, complete the following tasks. Given data set: *Employee data.csv" data 1. Identify types of variables and the level of measurements. 2. Choose two types of categorical variables. a. Determine the descriptive statistics. b. Interpret the descriptive statistics. B educ gender Nm 1 id 2 3 4 5 1 m 2 m D jobcat 15 16 12 Nm 98 6 LO 3 f 4f 5 m 6 m 7 m 8 f 9f 10 f 11 f 8 15 15 15 7 E F G H I salary salbegin jobtime prevexp minority 3 57000 27000 98 144 1 40200 18750 98 36 1 21450 12000 98 381 1 21900 13200 190 1 45000 21000 98 138 1 32100 13500 98 67 0 1 36000 18750 98 114 0 1 21900 9750 98 0 0 1 27900 12750 98 115 0 1 24000 13500 98 244 0 1 30300 16500 98 143 0 1 27300 13500 97 66 0 1 40800 15000 97 24 0 1 46000 14250 97 48 0 3 103750 27510 97 70 0 1 42300 14250 97 103 0 1 26250 11550 97 48 0 1 38850 15000 97 17 0 10 11 12 13 14 15 16 17 18 19 12 15 12 16 12 12 15 16 12 12 16 15 m 16 m 17 m 18 m 19 m 20 f 21 f Employee data Descriptive and Visualizing Data Using R Studio Based on the given set of data, complete the following tasks. Given data set: *Employee data.csv" data 1. Identify types of variables and the level of measurements. 2. Choose two types of categorical variables. a. Determine the descriptive statistics. b. Interpret the descriptive statistics. B educ gender Nm 1 id 2 3 4 5 1 m 2 m D jobcat 15 16 12 Nm 98 6 LO 3 f 4f 5 m 6 m 7 m 8 f 9f 10 f 11 f 8 15 15 15 7 E F G H I salary salbegin jobtime prevexp minority 3 57000 27000 98 144 1 40200 18750 98 36 1 21450 12000 98 381 1 21900 13200 190 1 45000 21000 98 138 1 32100 13500 98 67 0 1 36000 18750 98 114 0 1 21900 9750 98 0 0 1 27900 12750 98 115 0 1 24000 13500 98 244 0 1 30300 16500 98 143 0 1 27300 13500 97 66 0 1 40800 15000 97 24 0 1 46000 14250 97 48 0 3 103750 27510 97 70 0 1 42300 14250 97 103 0 1 26250 11550 97 48 0 1 38850 15000 97 17 0 10 11 12 13 14 15 16 17 18 19 12 15 12 16 12 12 15 16 12 12 16 15 m 16 m 17 m 18 m 19 m 20 f 21 f Employee data
Step by Step Solution
There are 3 Steps involved in it

Get step-by-step solutions from verified subject matter experts