

Question: Descriptive stanstics: BMI values - 21.2, 24.5, 23.2, 23.4, 26.4, 29.0, 21.2, 22.7, 28.5, 29.3, 21.2, 22.7 Calculate the: 0 Mean =-23.52 o Median
Descriptive stanstics:\ BMI values - 21.2, 24.5, 23.2, 23.4, 26.4, 29.0, 21.2, 22.7, 28.5, 29.3, 21.2, 22.7\ Calculate the:\ 0 Mean
=-23.52\ o Median
=_(23.3)\ o Mode
=_(21.2)\ o
,Range
=_(5.2)\ How many participants would be in each of the following "-tiles"?\ o Tertiles
=groups of\ o Quartiles
=groups of\ o Order the values and draw a verticle line between the tertiles.\ Inferential statistics:\ Decide if you would use a t-test or ANOVA for the scenarios below?\ o Comparing supplement A and supplement B for decreased in BP-\ o Looking at differences in weight loss of calorie restriction, keto, and fasting-\ o Determining the difference between males and females for dietary quality-\ o Determining difference in effectiveness of a health program amongst 7 fire depts.-\ Circle which of the following results is significant if the level of significance is set at 0.01 (may be more than one).\ 0 Change in
BP=-9mmHg,p=0.03\ o Change in
BP=-18mmHg,p=0.001\ o Change in
BP=-12mmHg,p=0.05\ o Change in
BP=-2mmHg,p=0.017\ Decide if the following correlations are weak, moderate, or strong. Also note if they are direct or inverse relationships.\
0,r=0.98\ 0,r=-0.25\ 0,r=-0.54\ 0,r=0.63\ Note what % of the variance in BG is explained by consumption of the following foods.\
0,r^(2)=0.47\ 0,r_(n)^(2)=0.38\ 0,r_(n)^(2)=0.15\
% of the variance in BG is explained by soda consumption \
% of the variance in BG is explained by whole grain consumption \ Decide if each of the following are significant. If so, do they increase or decrease risk or odds?\ \\\\table[[0,
OR=0.34(0.21,0.44) 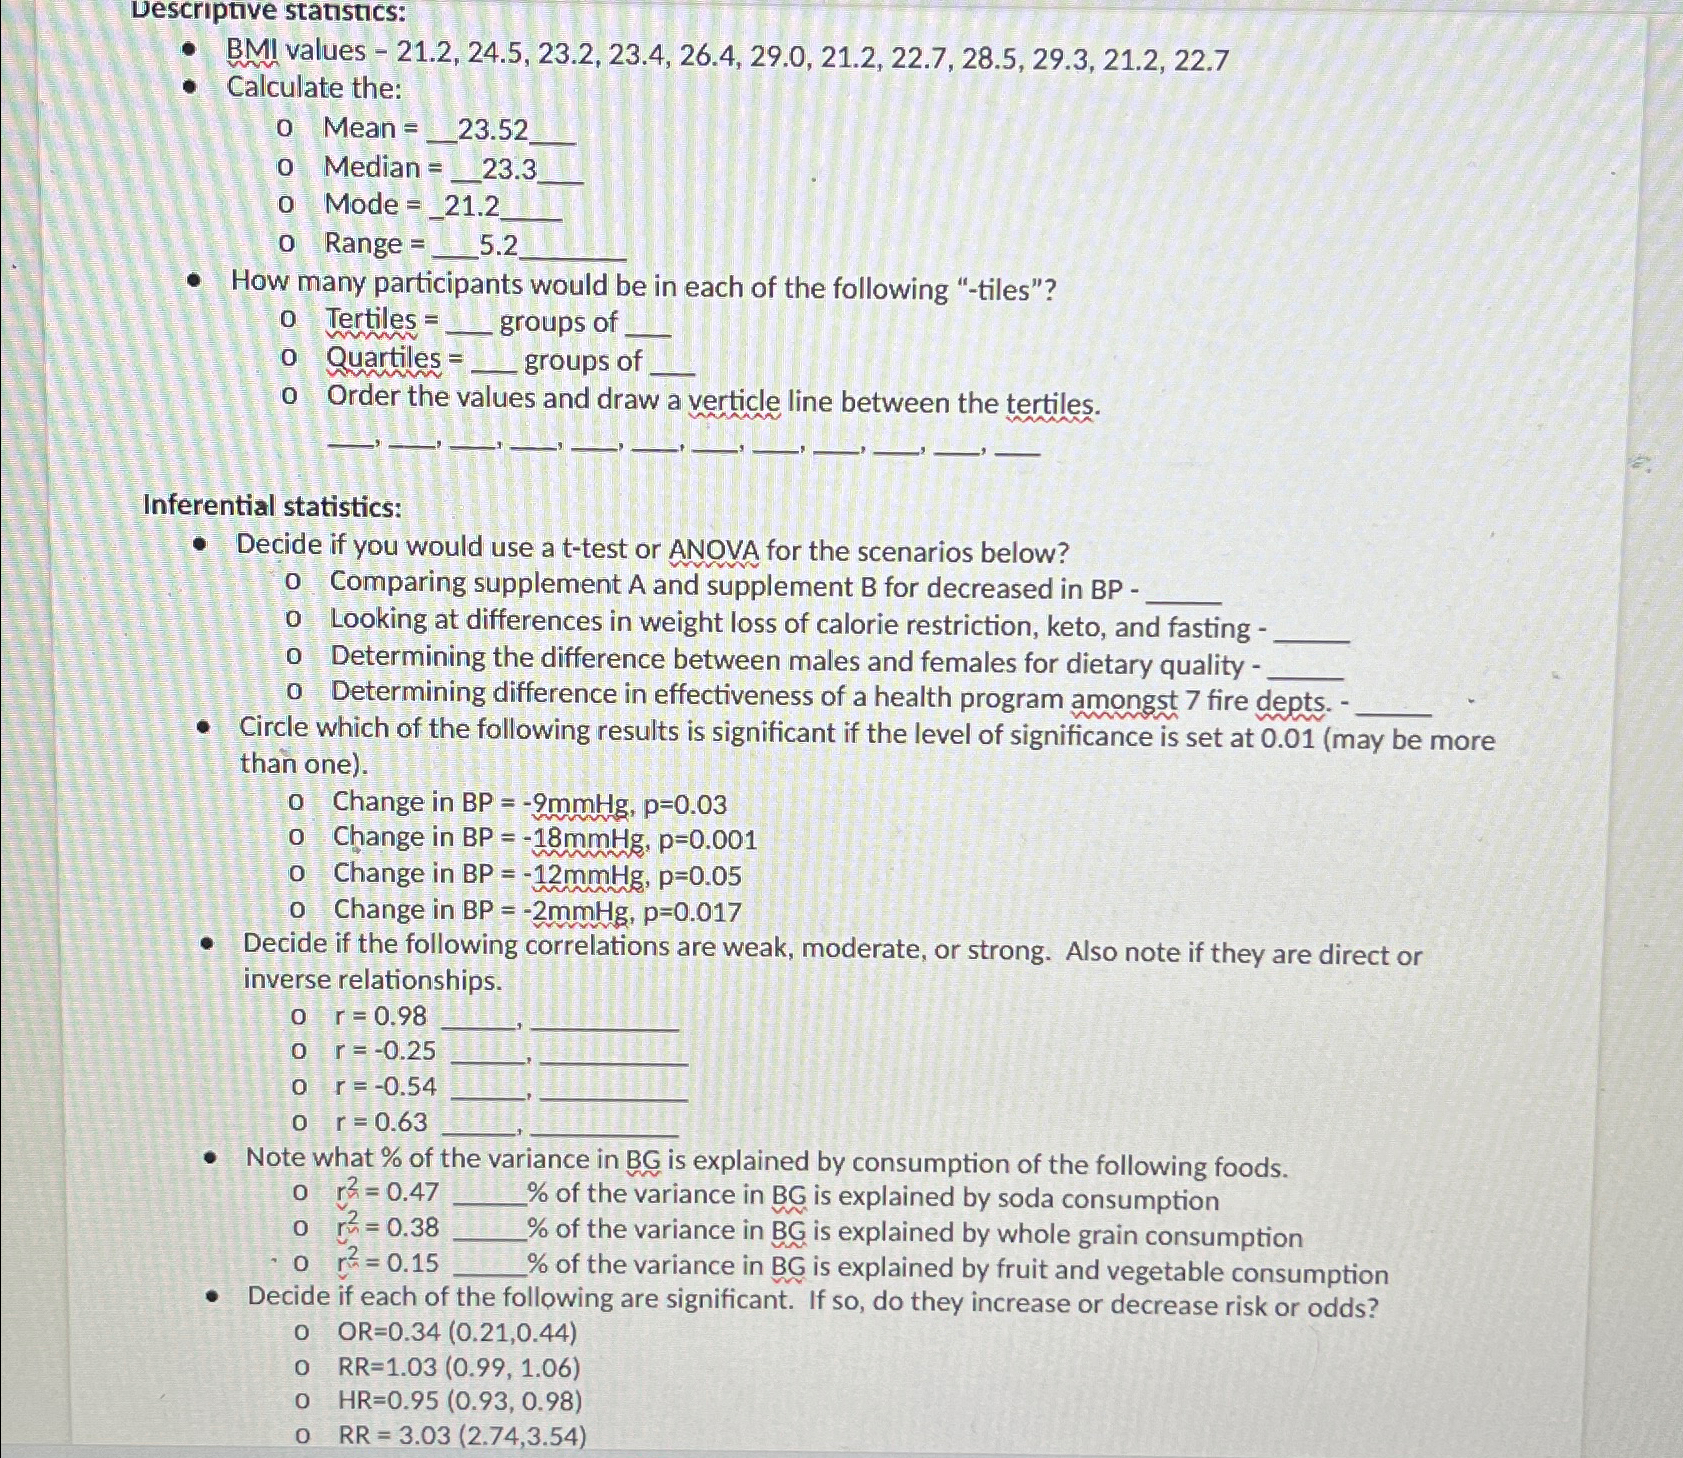
- BMI values - 21.2, 24.5, 23.2, 23.4, 26.4, 29.0, 21.2, 22.7, 28.5, 29.3, 21.2, 22.7 - Calculate the: o Mean =_23.52 o Median =23.3 - Mode =21.2 o Range =5.2 - How many participants would be in each of the following "-tiles"? 0 Tertiles = groups of 0 Quartiles = groups of o Order the values and draw a verticle line between the tertiles. Inferential statistics: - Decide if you would use a t-test or ANOVA for the scenarios below? o Comparing supplement A and supplement B for decreased in BP - o Looking at differences in weight loss of calorie restriction, keto, and fasting - 0 Determining the difference between males and females for dietary quality- 0 Determining difference in effectiveness of a health program amongst 7 fire depts. - - Circle which of the following results is significant if the level of significance is set at 0.01 (may be more than one). o Change in BP=9mmHg,p=0.03 0 Change in BP=18mmHg,p=0.001 0 Change in BP=12mmH, p=0.05 0 Change in BP=2mmHg,p=0.017 - Decide if the following correlations are weak, moderate, or strong. Also note if they are direct or inverse relationships. 0000r=0.98r=0.25r=0.54r=0.63 - Note what \% of the variance in BG is explained by consumption of the following foods. o r2=0.47 0r2=0.38 % of the variance in BG is explained by soda consumption o r2=0.15 % of the variance in BG is explained by whole grain consumption % of the variance in BG is explained by fruit and vegetable consumption - Decide if each of the following are significant. If so, do they increase or decrease risk or odds? o OR=0.34(0.21,0.44) O RR=1.03(0.99,1.06) 0HR=0.95(0.93,0.98) o RR=3.03(2.74,3.54)
Step by Step Solution
There are 3 Steps involved in it

Get step-by-step solutions from verified subject matter experts