

Question: Descriptive Statistics Assignment What data file was used for this assignment (e.g., Texas1001)? Texas1015 Hand Calculation for Vehicle Speed at Time of Crash. Speed was
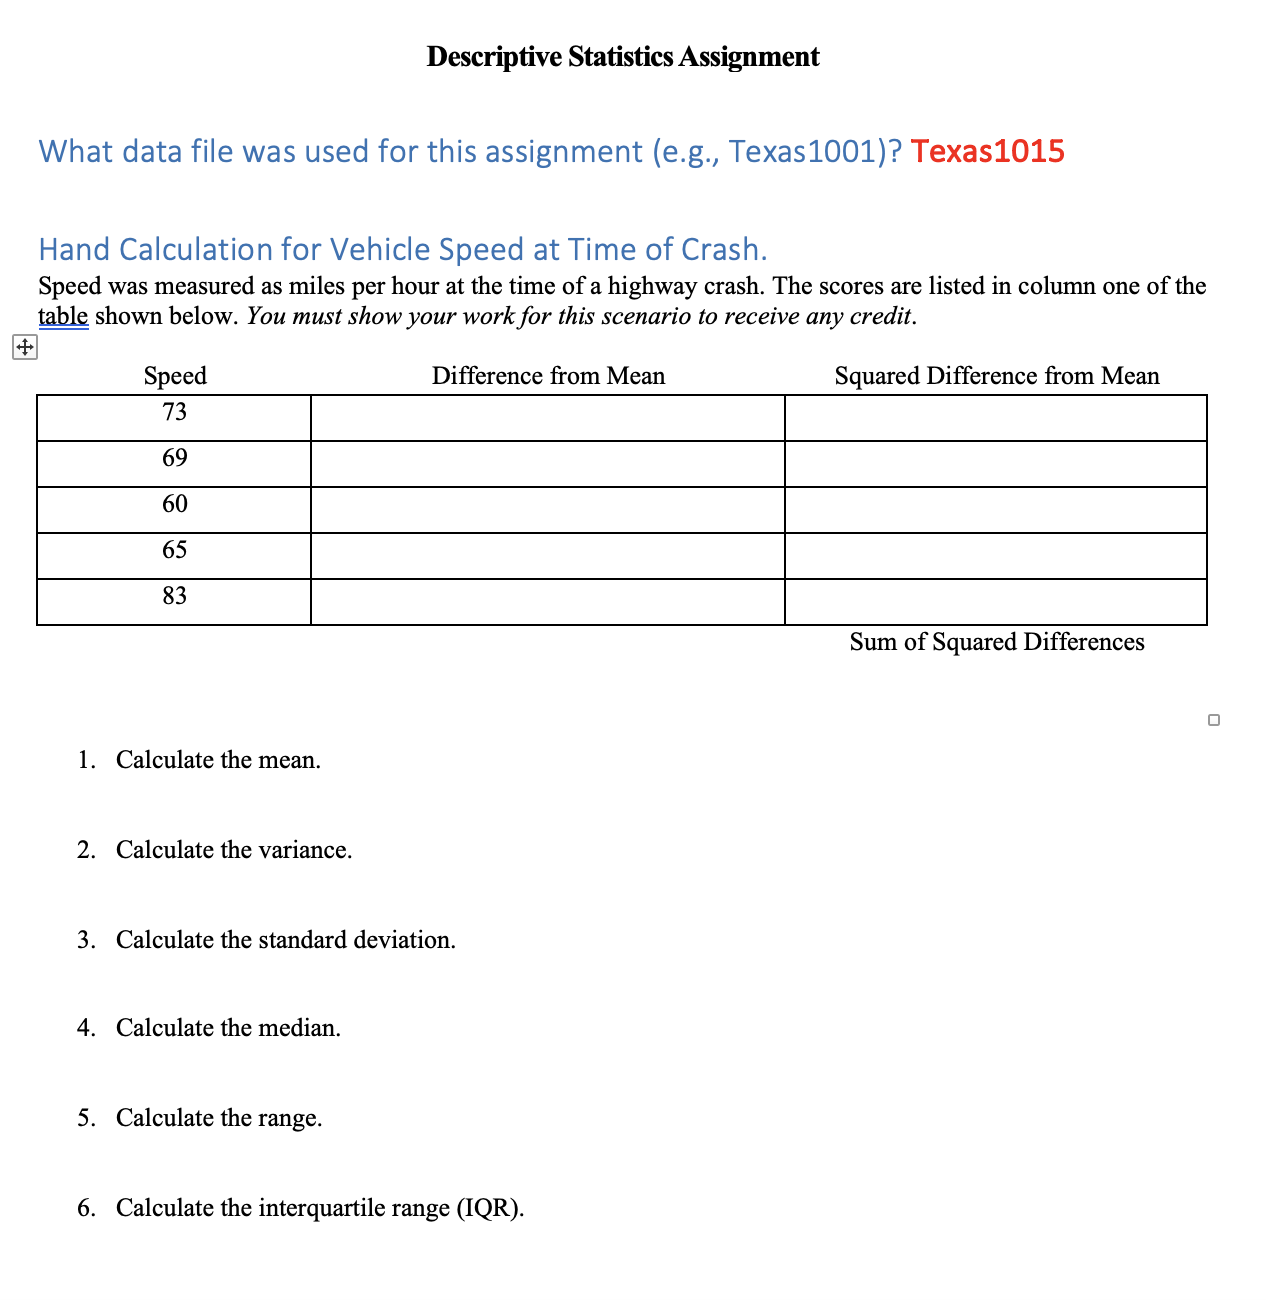
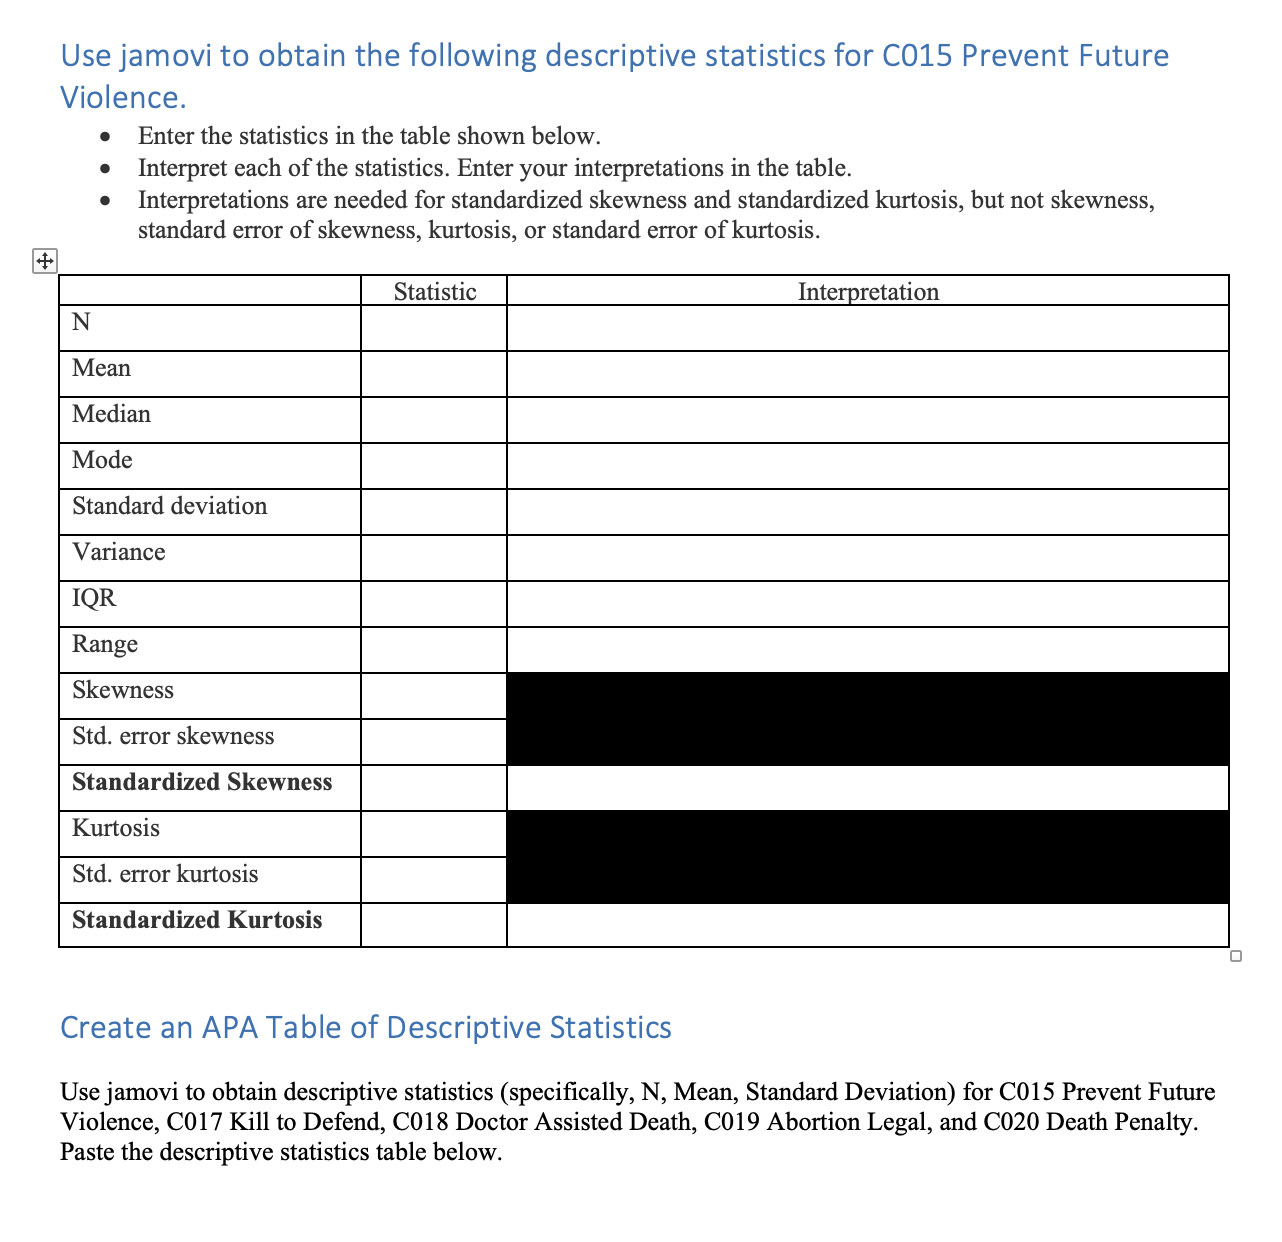
Descriptive Statistics Assignment What data file was used for this assignment (e.g., Texas1001)? Texas1015 Hand Calculation for Vehicle Speed at Time of Crash. Speed was measured as miles per hour at the time of a highway crash. The scores are listed in column one of the table shown below. You must show your work for this scenario to receive any credit. Speed Difference from Mean Squared Difference from Mean Sum of Squared Differences 1. Calculate the mean. 2. Calculate the variance. 3. Calculate the standard deviation. 4. Calculate the median. 5. Calculate the range. 6. Calculate the interquartile range (IQR). Use jamovi to obtain the following descriptive statistics for C015 Prevent Future Violence. . Enter the statistics in the table shown below. . Interpret each of the statistics. Enter your interpretations in the table. Interpretations are needed for standardized skewness and standardized kurtosis, but not skewness, standard error of skewness, kurtosis, or standard error of kurtosis. Statistic Interpretation N Mean Median Mode Standard deviation Variance QR Range Skewness Std. error skewness Standardized Skewness Kurtosis Std. error kurtosis Standardized Kurtosis Create an APA Table of Descriptive Statistics Use jamovi to obtain descriptive statistics (specifically, N, Mean, Standard Deviation) for C015 Prevent Future Violence, C017 Kill to Defend, C018 Doctor Assisted Death, C019 Abortion Legal, and C020 Death Penalty. Paste the descriptive statistics table below
Step by Step Solution
There are 3 Steps involved in it

Get step-by-step solutions from verified subject matter experts