

Question: descriptive statistics In Exercises 9 and 10, use the data set, which represents the results of a survey that asked U.S. full-time university and college
descriptive statistics
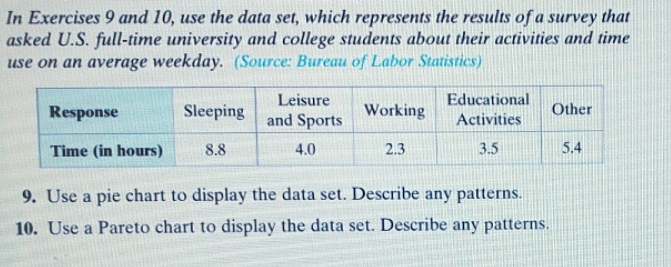
In Exercises 9 and 10, use the data set, which represents the results of a survey that asked U.S. full-time university and college students about their activities and time use on an average weekday. (Source: Bureau of Labor Statistics) Leisure Educational Response Sleeping and Sports Working Other Activities Time (in hours) 8.8 4.0 2.3 3.5 5.4 9. Use a pie chart to display the data set. Describe any patterns. 10. Use a Pareto chart to display the data set. Describe any patterns
Step by Step Solution
There are 3 Steps involved in it
1 Expert Approved Answer
Step: 1 Unlock

Question Has Been Solved by an Expert!
Get step-by-step solutions from verified subject matter experts
Step: 2 Unlock
Step: 3 Unlock