

Question: Descriptive Statistics Mean Std. Deviation. N Intake 6.7000 2.05359 30 Discharge 5.4000 1.84951 30 Follow-Up 5.9667 2.05918 30 Pairwise Comparisons Measure: MEASURE_1 Mean 95%
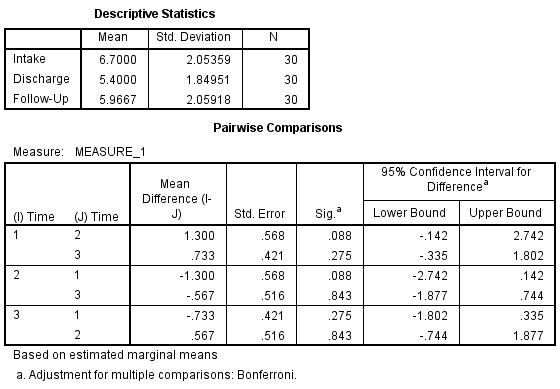
Descriptive Statistics Mean Std. Deviation. N Intake 6.7000 2.05359 30 Discharge 5.4000 1.84951 30 Follow-Up 5.9667 2.05918 30 Pairwise Comparisons Measure: MEASURE_1 Mean 95% Confidence Interval for Difference Difference (I- (1) Time (J) Time J) Std. Error Sig.a Lower Bound Upper Bound 1 2 1.300 .568 .088 -142 2.742 3 .733 .421 .275 -.335 1.802 2 1 -1.300 .568 .088 -2.742 .142 3 -.567 .516 .843 -1.877 .744 3 1 -.733 .421 .275 -1.802 .335 2 .567 .516 .843 -.744 1.877 Based on estimated marginal means a. Adjustment for multiple comparisons: Bonferroni.
Step by Step Solution
There are 3 Steps involved in it
1 Expert Approved Answer
Step: 1 Unlock

Question Has Been Solved by an Expert!
Get step-by-step solutions from verified subject matter experts
Step: 2 Unlock
Step: 3 Unlock