

Question: Descriptive Statistics N Skewness Kurtosis Statistic Statistic Std. Error Statistic Std. Error quiz1 105 -.729 .236 072 467 gpa 105 -.232 236 -.735 .467 total
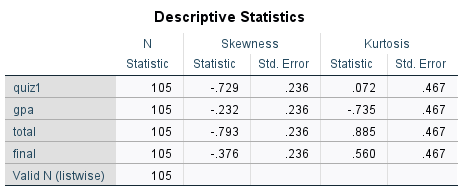


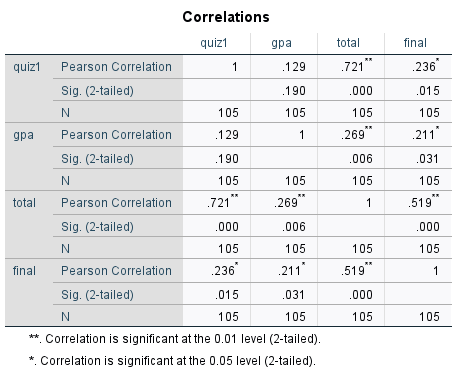
Descriptive Statistics N Skewness Kurtosis Statistic Statistic Std. Error Statistic Std. Error quiz1 105 -.729 .236 072 467 gpa 105 -.232 236 -.735 .467 total 105 -.793 .236 .885 .467 final 105 -.376 236 560 467 Valid N (listwise) 105Correlations quiz1 gpa total final quiz1 Pearson Correlation .129 721 236 Sig. (2-tailed) 190 000 015 N 105 105 105 105 gpa Pearson Correlation .129 1 .269 .211 Sig. (2-tailed) 190 006 .031 N 105 105 105 105 total Pearson Correlation 721 269 1 519 Sig. (2-tailed) 000 006 000 N 105 105 105 105 final Pearson Correlation 236 .211 519 1 Sig. (2-tailed) 015 031 000 N 105 105 105 105 * Correlation is significant at the 0.01 level (2-tailed). *. Correlation is significant at the 0.05 level (2-tailed)
Step by Step Solution
There are 3 Steps involved in it

Get step-by-step solutions from verified subject matter experts