

Question: Descriptive Statistics: Residue iResults do not use current data. Statistics Variable Residue N N* Mean SE Mean 20 0 4.020 StDev Minimum Q1 Median
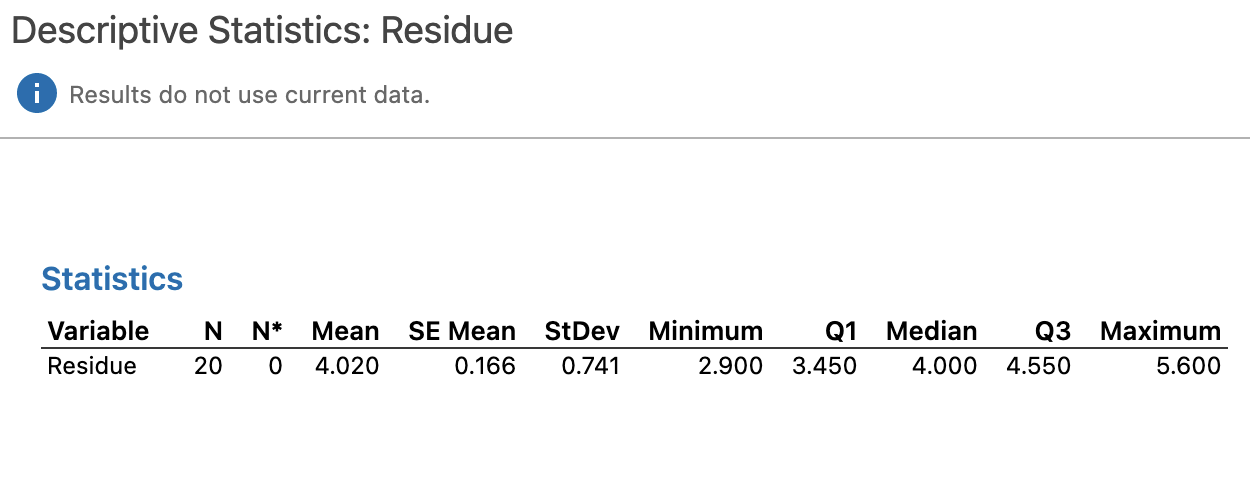
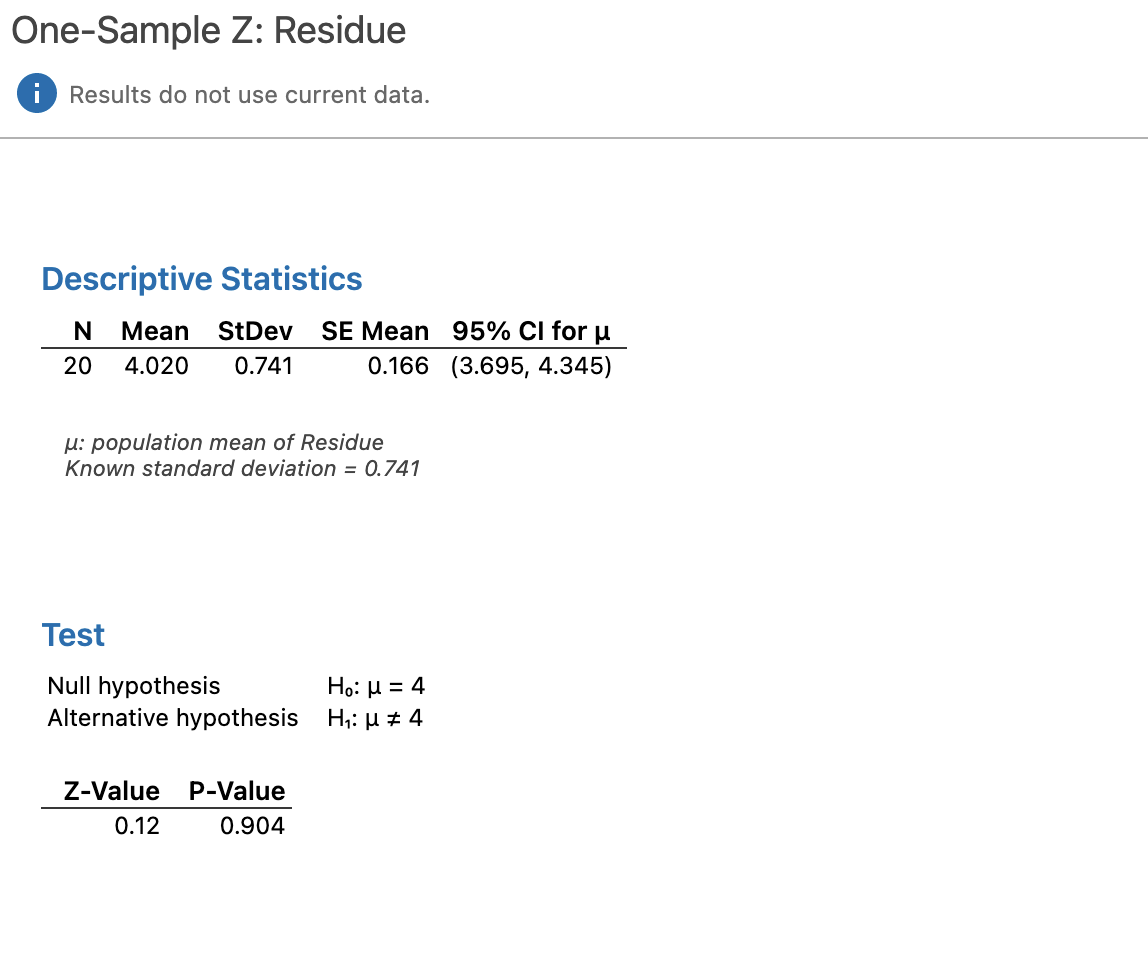
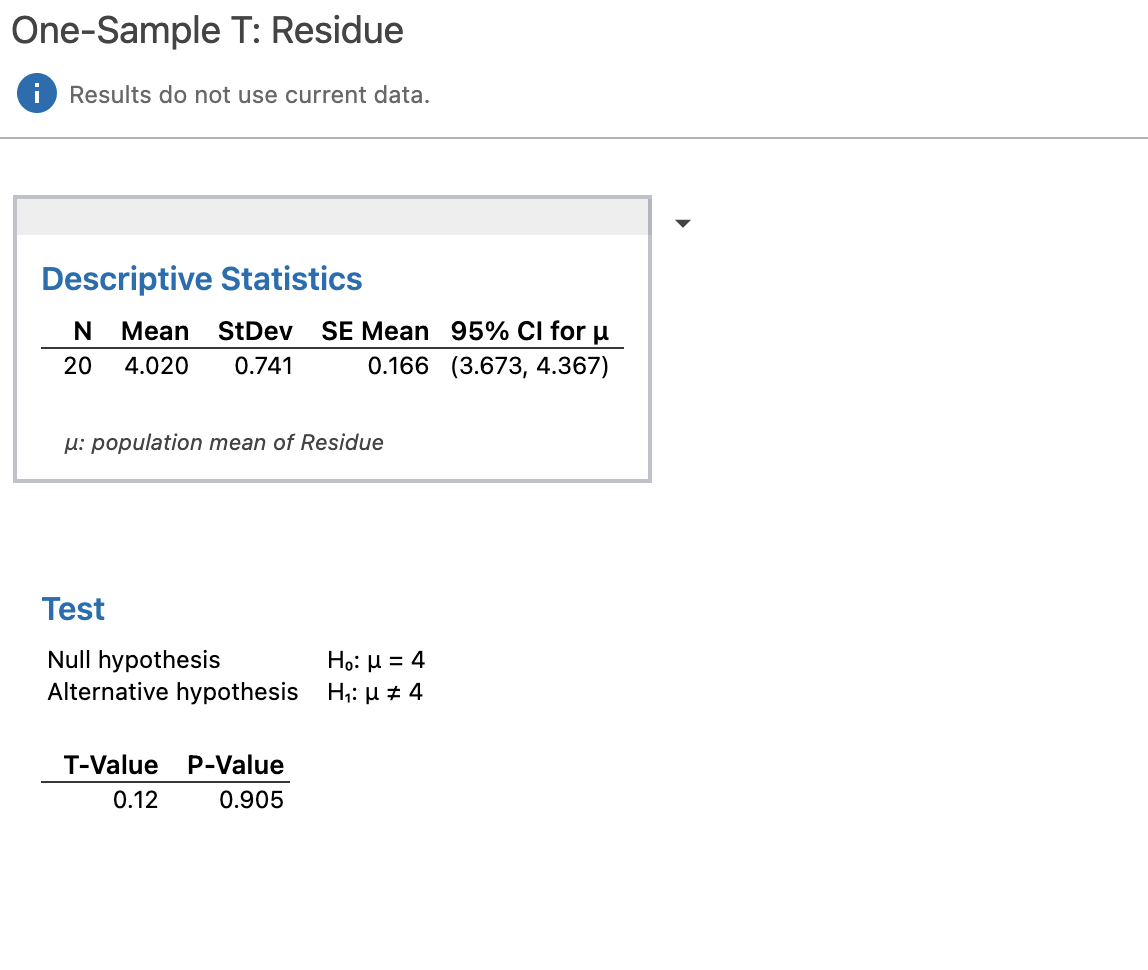
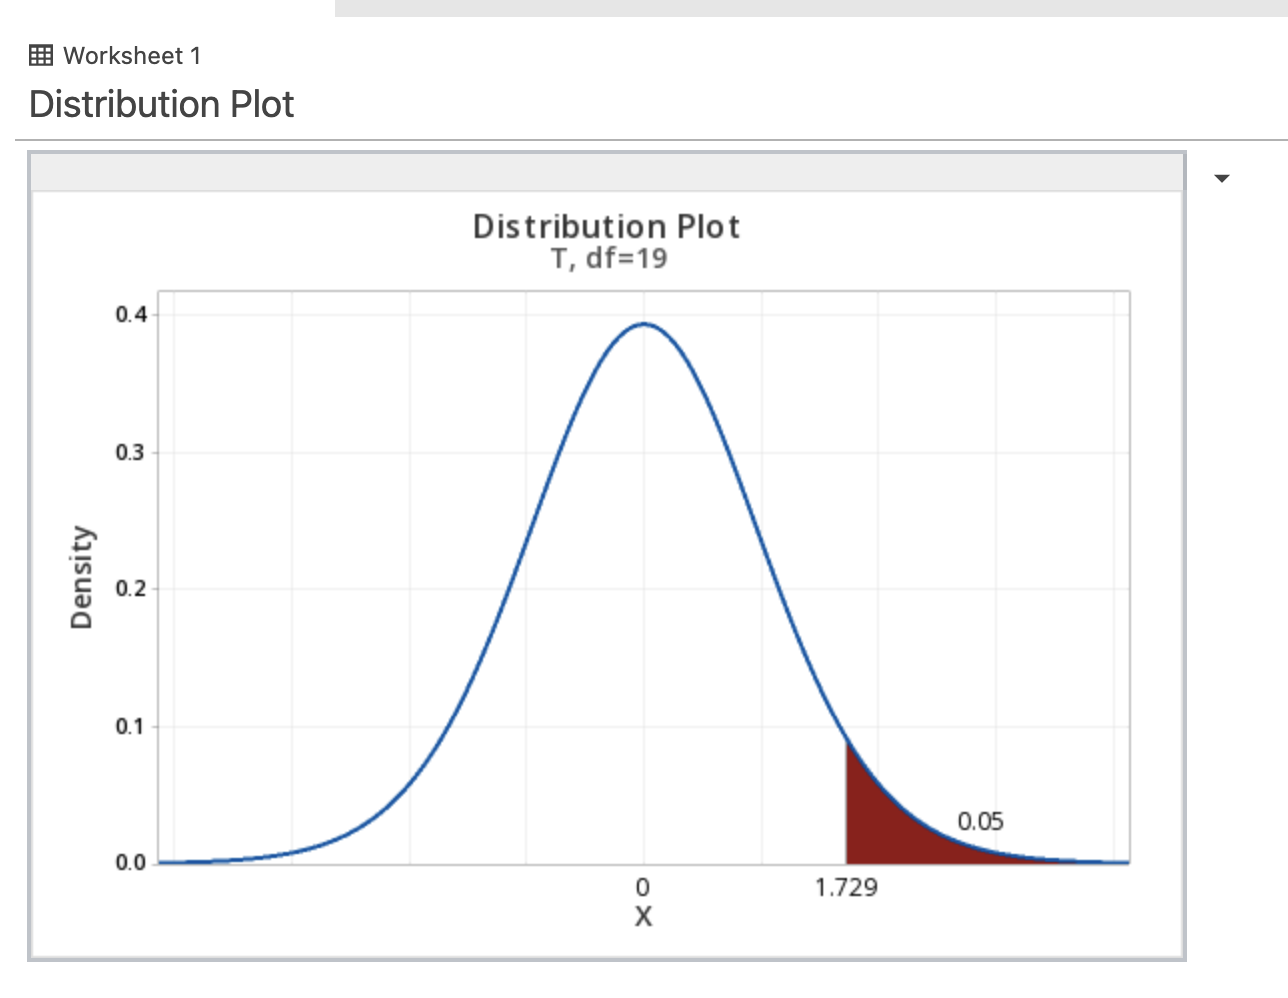
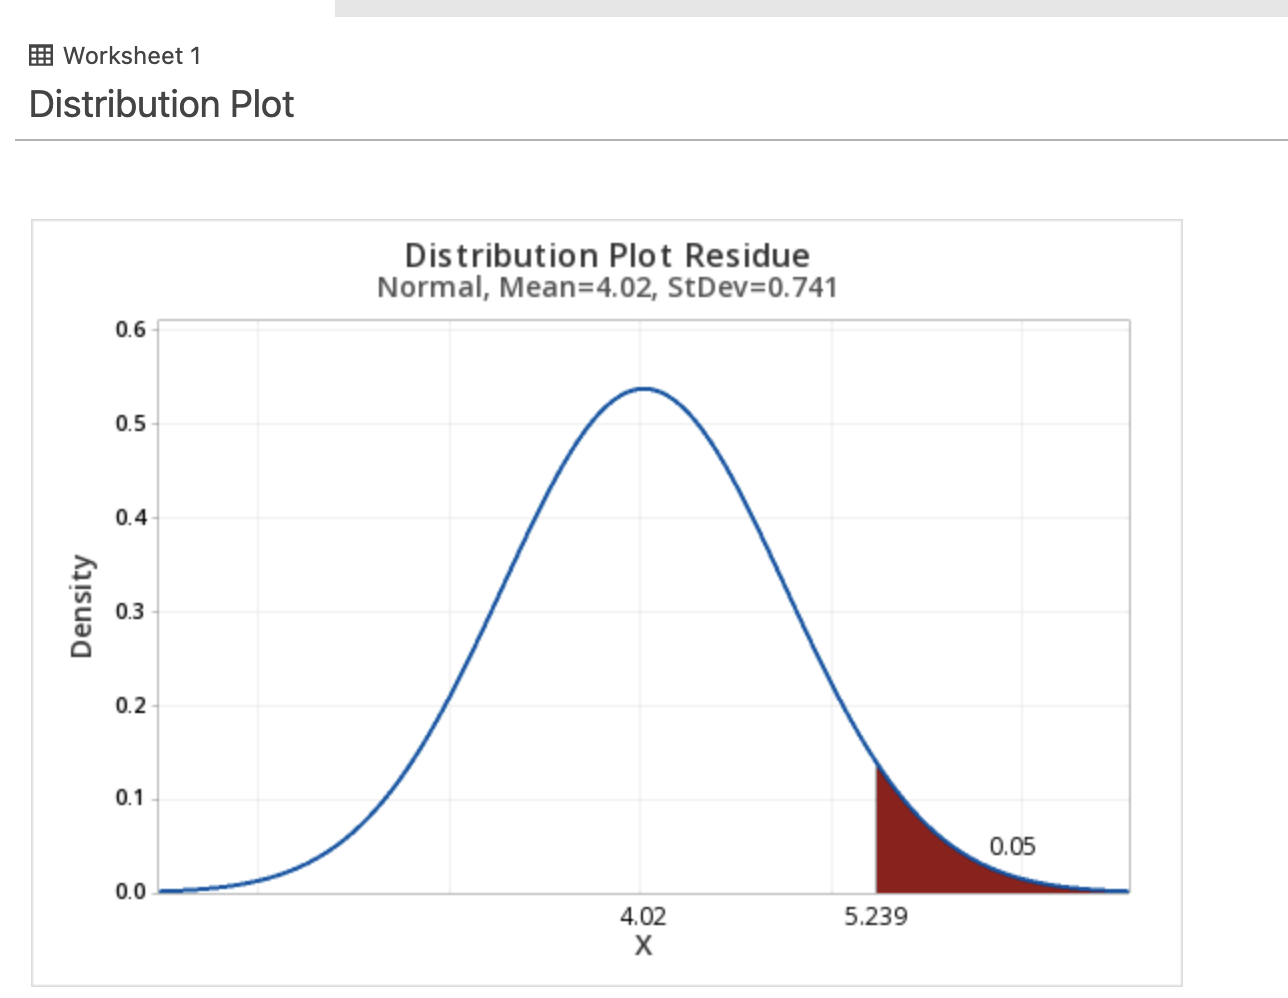
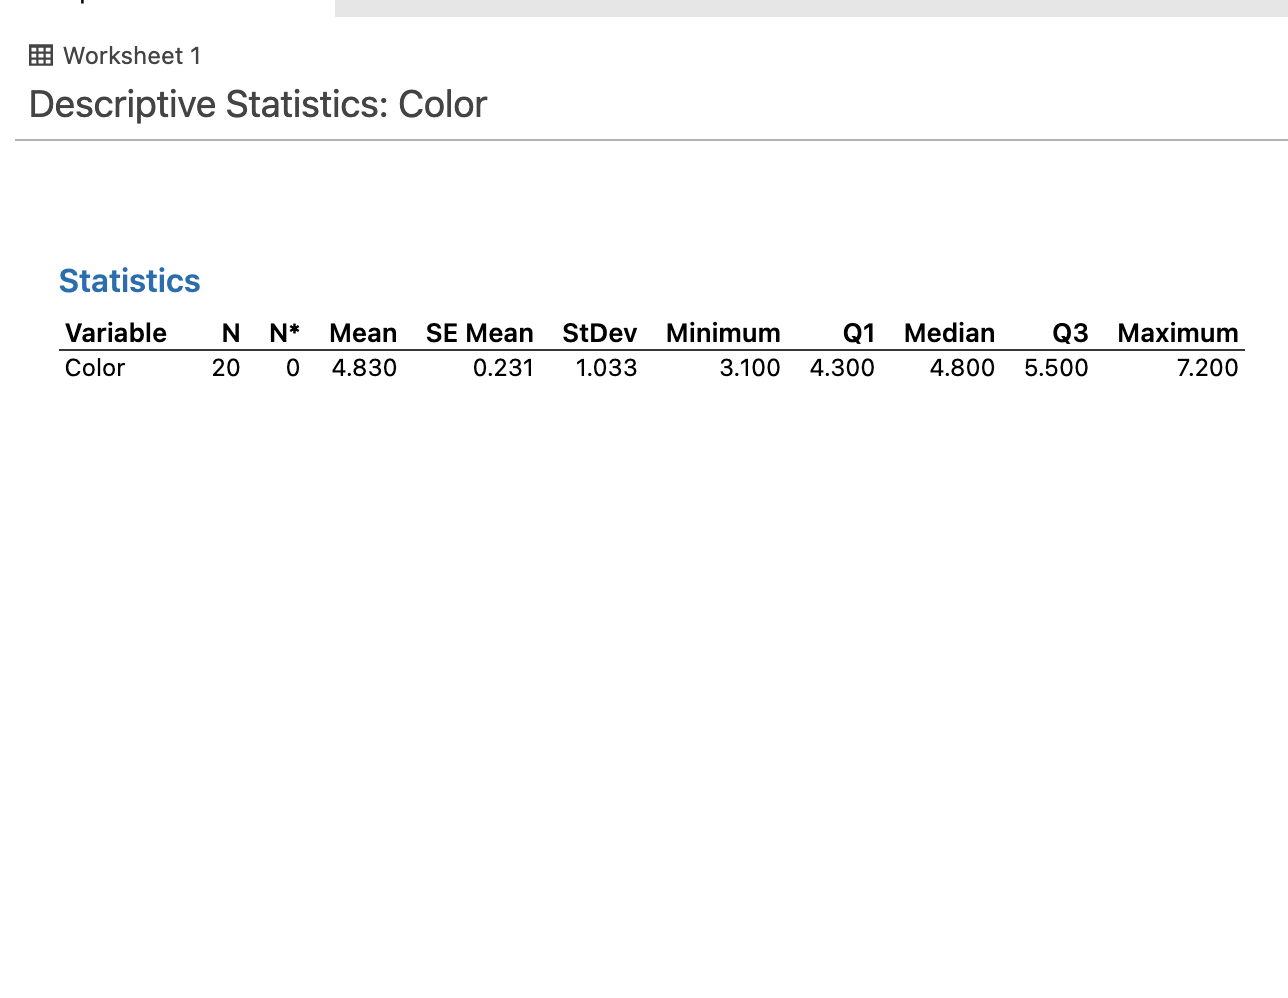
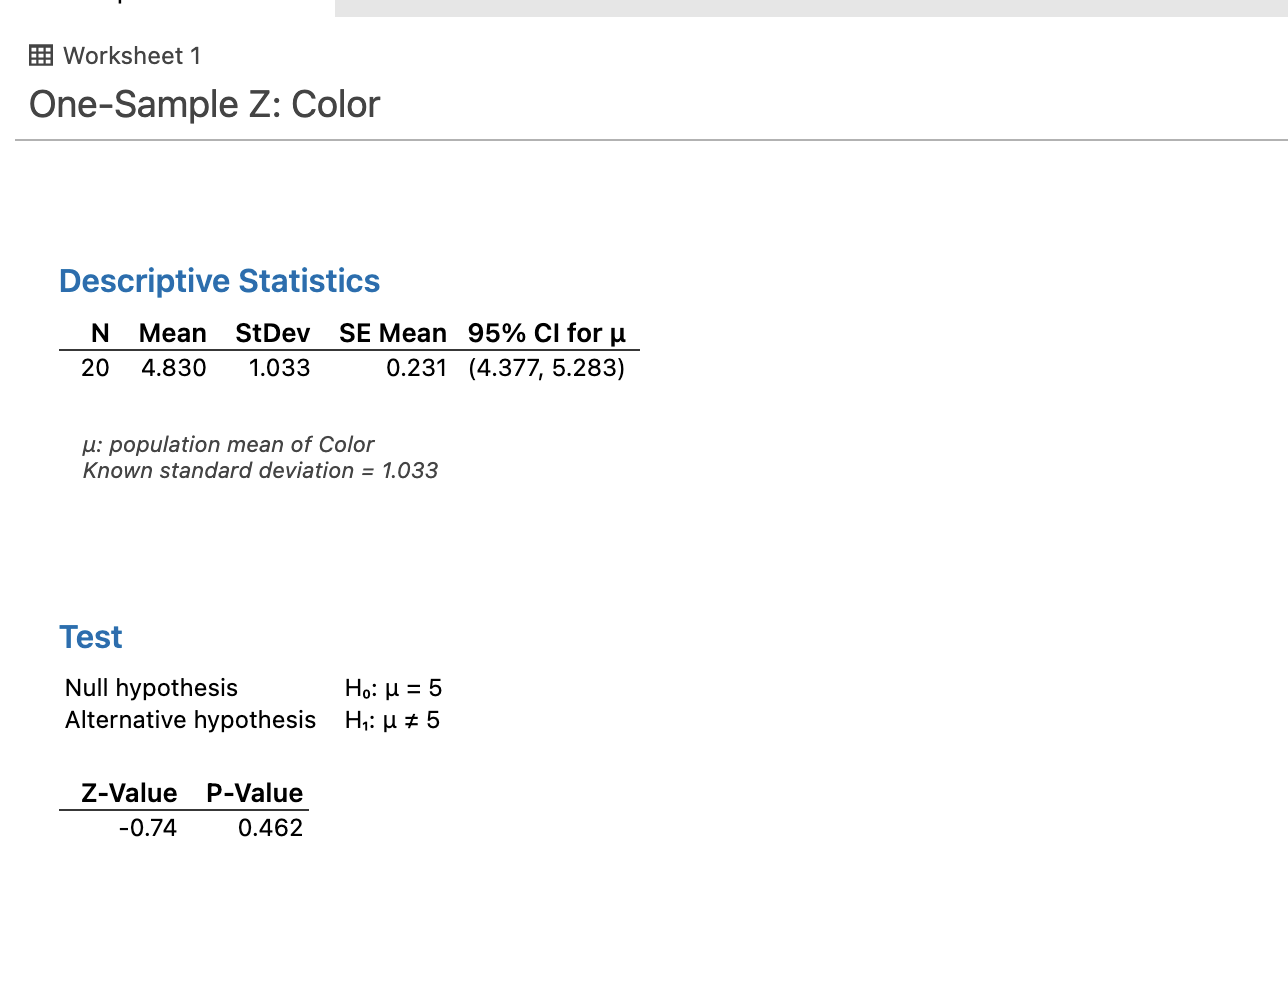
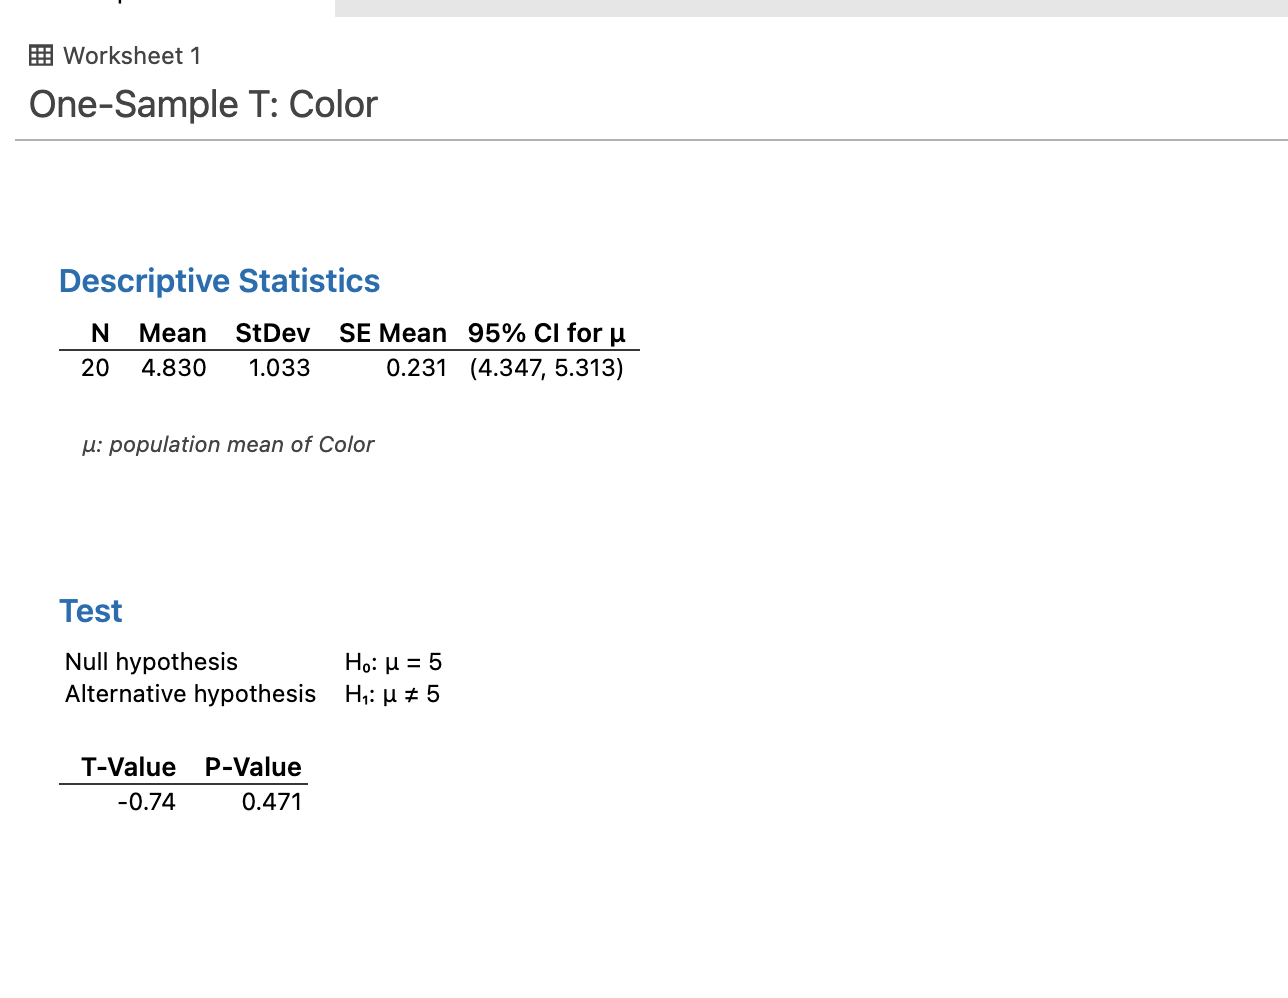
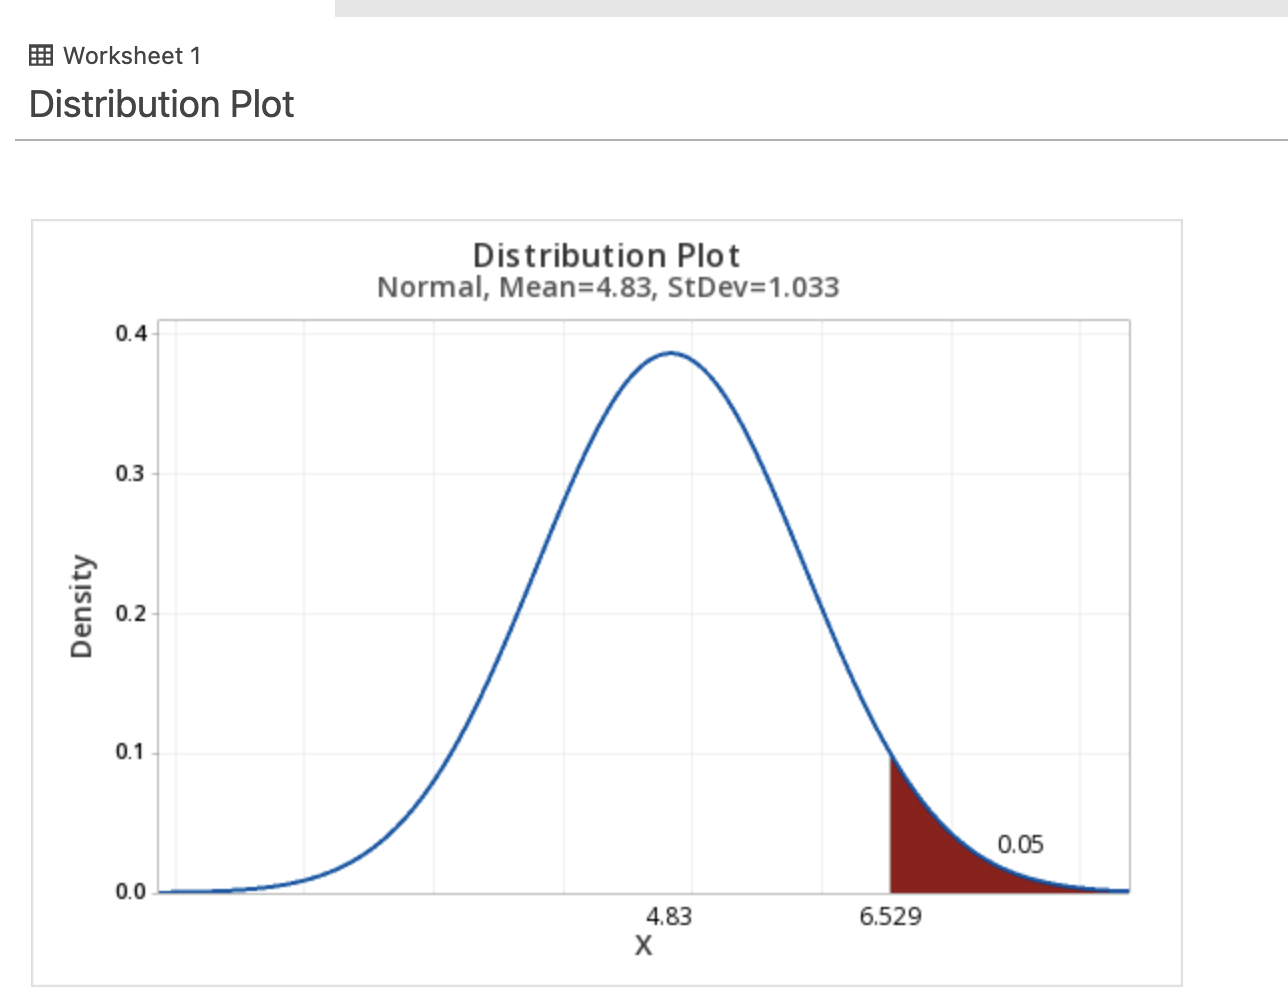
Descriptive Statistics: Residue iResults do not use current data. Statistics Variable Residue N N* Mean SE Mean 20 0 4.020 StDev Minimum Q1 Median Q3 Maximum 0.166 0.741 2.900 3.450 4.000 4.550 5.600 One-Sample Z: Residue iResults do not use current data. Descriptive Statistics N Mean StDev SE Mean 95% CI for 20 4.020 0.741 0.166 (3.695, 4.345) : population mean of Residue Known standard deviation = 0.741 Test Null hypothesis Ho: = 4 Alternative hypothesis H: #4 Z-Value P-Value 0.12 0.904 One-Sample T: Residue iResults do not use current data. Descriptive Statistics N Mean StDev SE Mean 20 4.020 0.741 95% CI for 0.166 (3.673, 4.367) : population mean of Residue Test Null hypothesis Ho: = 4 Alternative hypothesis H: # 4 T-Value P-Value 0.12 0.905 Worksheet 1 Distribution Plot Density 0.4 0.3 0.2 0.1 Distribution Plot T, df=19 0.0 0 1.729 0.05 Worksheet 1 Distribution Plot Density 0.6 Distribution Plot Residue Normal, Mean=4.02, StDev=0.741 0.5 0.4 0.3 0.2 0.1 0.0 4.02 5.239 X 0.05 Worksheet 1 Descriptive Statistics: Color Statistics Variable N N* Mean SE Mean StDev Minimum Q1 Median Color 20 0 4.830 0.231 1.033 3.100 4.300 4.800 5.500 Q3 Maximum 7.200 Worksheet 1 One-Sample Z: Color Descriptive Statistics N Mean StDev SE Mean 95% CI for 20 4.830 1.033 0.231 (4.377, 5.283) : population mean of Color Known standard deviation = 1.033 Test Null hypothesis Ho: = 5 Alternative hypothesis H: 5 Z-Value P-Value -0.74 0.462 Worksheet 1 One-Sample T: Color Descriptive Statistics N Mean StDev SE Mean 95% CI for 20 4.830 1.033 0.231 (4.347, 5.313) : population mean of Color Test Null hypothesis Ho: = 5 Alternative hypothesis H: 5 T-Value P-Value -0.74 0.471 Worksheet 1 Distribution Plot Density 0.4 0.3 0.2 0.1 Distribution Plot Normal, Mean=4.83, StDev=1.033 0.0 4.83 6.529 0.05
Step by Step Solution
There are 3 Steps involved in it

Get step-by-step solutions from verified subject matter experts