

Question: Descriptive Statistics Std Mean Deviation N age 14.51 1.592 221 rads 79.11 14.429 215 cdrs 60.05 10.366 221 anxiety .25 .431 220 adhd 18.72 8.707
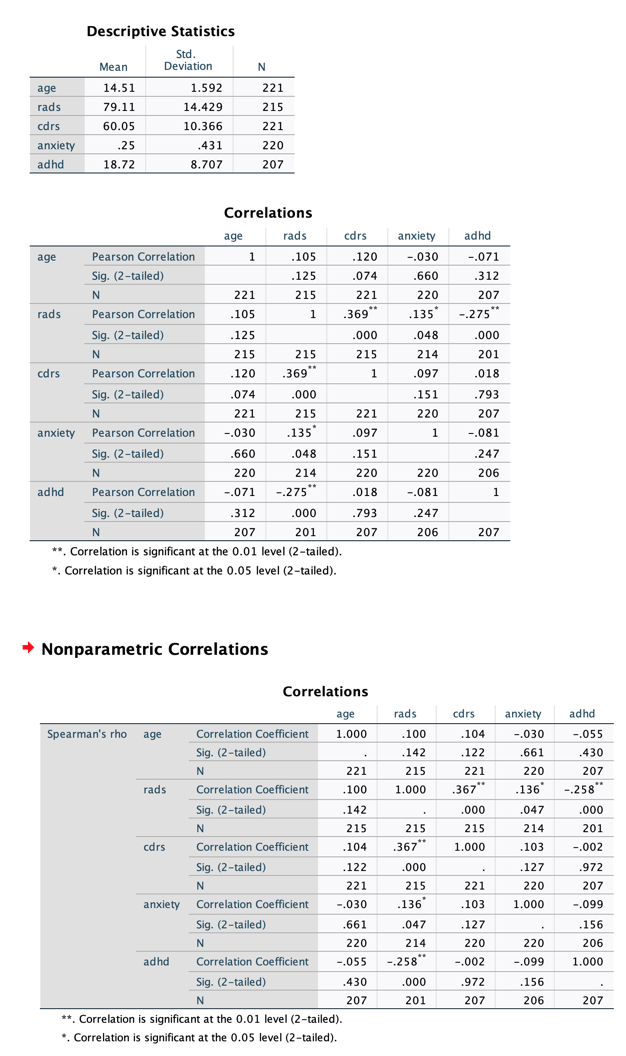
Descriptive Statistics Std Mean Deviation N age 14.51 1.592 221 rads 79.11 14.429 215 cdrs 60.05 10.366 221 anxiety .25 .431 220 adhd 18.72 8.707 207 Correlations age rads cdrs anxiety adhd age Pearson Correlation 1 105 120 -.030 -.071 Sig. (2-tailed) .125 .074 660 .312 N 221 215 221 220 207 rads Pearson Correlation .105 1 .369 .135 -.275 Sig. (2-tailed) .125 000 048 000 N 215 215 215 214 201 cdrs Pearson Correlation 120 .369 1 097 018 Sig. (2-tailed) .074 .000 151 .793 N 221 215 221 220 207 anxiety Pearson Correlation -.030 .135 097 1 -.081 Sig. (2-tailed) 660 048 .151 .247 N 220 214 220 220 206 adhd Pearson Correlation -.071 -.275 .018 -.081 1 Sig. (2-tailed) .312 000 .793 .247 N 207 201 207 206 207 **. Correlation is significant at the 0.01 level (2-tailed). *. Correlation is significant at the 0.05 level (2-tailed). # Nonparametric Correlations Correlations age rads cdrs anxiety adhd Spearman's rho age Correlation Coefficient 1.000 100 104 -.030 -.055 Sig. (2-tailed) .142 .122 661 .430 N 221 215 221 220 207 rads Correlation Coefficient .100 1.000 .367" .136 -.258 Sig. (2-tailed) .142 000 047 000 N 215 215 215 214 201 cdrs Correlation Coefficient .104 .367 1.000 103 -.002 Sig. (2-tailed) 122 000 .127 .972 N 221 215 221 220 207 anxiety Correlation Coefficient -.030 136 103 1.000 -.099 Sig. (2-tailed) .661 047 127 .156 N 220 214 220 220 206 adhd Correlation Coefficient -.055 -.258 -.002 -.099 1.000 Sig. (2-tailed) 430 000 .972 .156 N 207 201 207 206 207 **. Correlation is significant at the 0.01 level (2-tailed). ". Correlation is significant at the 0.05 level (2-tailed).\f
Step by Step Solution
There are 3 Steps involved in it

Get step-by-step solutions from verified subject matter experts