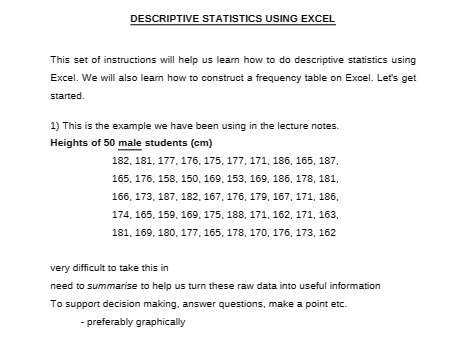
Question: DESCRIPTIVE STATISTICS USING EXCEL This set of instructions will help us learn how to do descriptive statistics using Excel. We will also learn how to

DESCRIPTIVE STATISTICS USING EXCEL This set of
DESCRIPTIVE STATISTICS USING EXCEL This set of instructions will help us learn how to do descriptive statistics using Excel. We will also learn how to construct a frequency table on Excel. Let's get started. 1) This is the example we have been using in the lecture notes. Heights of 50 male students (cm) 182, 181, 177, 176, 175, 177, 171, 186, 165, 187, 165, 176, 158, 150, 169, 153, 169, 186, 178, 181, 166, 173, 187, 182, 167, 176, 179, 167, 171, 186, 174, 165, 159, 169, 175, 188, 171, 162, 171, 163, 181, 169, 180, 177, 165, 178, 170, 176, 173, 162 very difficult to take this in need to summanse to help us turn these raw data into useful information To support decision making, answer questions, make a point etc. - preferably graphically

Step by Step Solution

There are 3 Steps involved in it

1 Expert Approved Answer
Step: 1 Unlock blur-text-image
Question Has Been Solved by an Expert!

Get step-by-step solutions from verified subject matter experts

Step: 2 Unlock
Step: 3 Unlock

Students Have Also Explored These Related Mathematics Questions!