

Question: Descriptives 95% Confidence Interval for Mean Std. Deviation Std. Error Minimum Maximum 48 72 Lightly Patrolled Moderately Patrolled _ _ 54 59 Heavilly Patrolled .
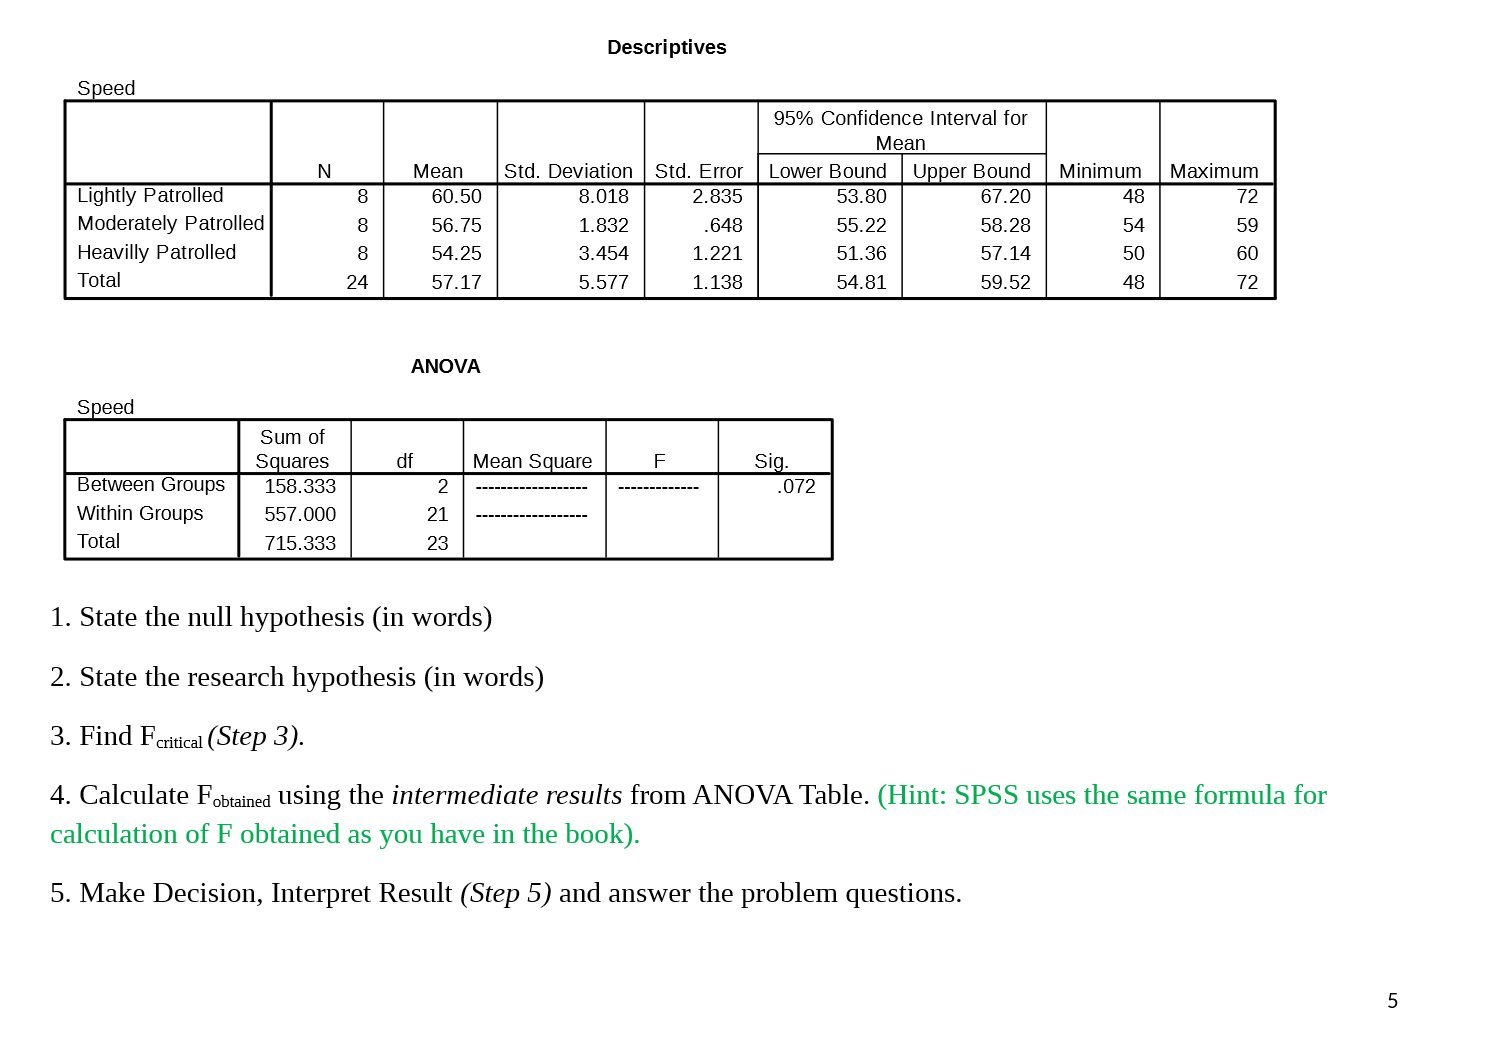
Descriptives 95% Confidence Interval for Mean Std. Deviation Std. Error Minimum Maximum 48 72 Lightly Patrolled Moderately Patrolled _ _ 54 59 Heavilly Patrolled . 50 60 Total _ 48 72 ANOVA Sum of Sruares Mean Snuare F Sin. Between Groups 158.333 2 -072 Within Groups 557.000 21 Total 715.333 23 1. State the null hypothesis (in words) 2. State the research hypothesis (in words) 3. Find Fain-cal (Step 3). 4. Calculate Form-Red using the intermediate results from ANOVA Table. (Hint: SPSS uses the same formula for calculation of F obtained as you have in the book). 5. Make Decision, Interpret Result (Step 5) and answer the problem questions
Step by Step Solution
There are 3 Steps involved in it

Get step-by-step solutions from verified subject matter experts