

Question: detailed answer 9. Use the graph to identify the value of p and o for each distribution. 117 316 9. Use the graph to identify
detailed answer

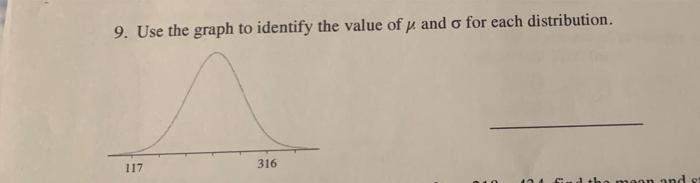
9. Use the graph to identify the value of p and o for each distribution. 117 316
9. Use the graph to identify the value of p and o for each distribution.
Step by Step Solution
There are 3 Steps involved in it
1 Expert Approved Answer
Step: 1 Unlock

Question Has Been Solved by an Expert!
Get step-by-step solutions from verified subject matter experts
Step: 2 Unlock
Step: 3 Unlock