Question: Detailed Histogram Exercise Directions 1. Open the Data Analysis tool found in the Data tab and select Descriptive Statistics. 2. For each variable (except ID),
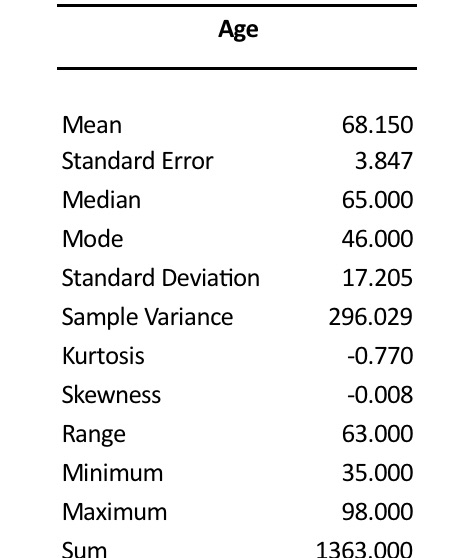
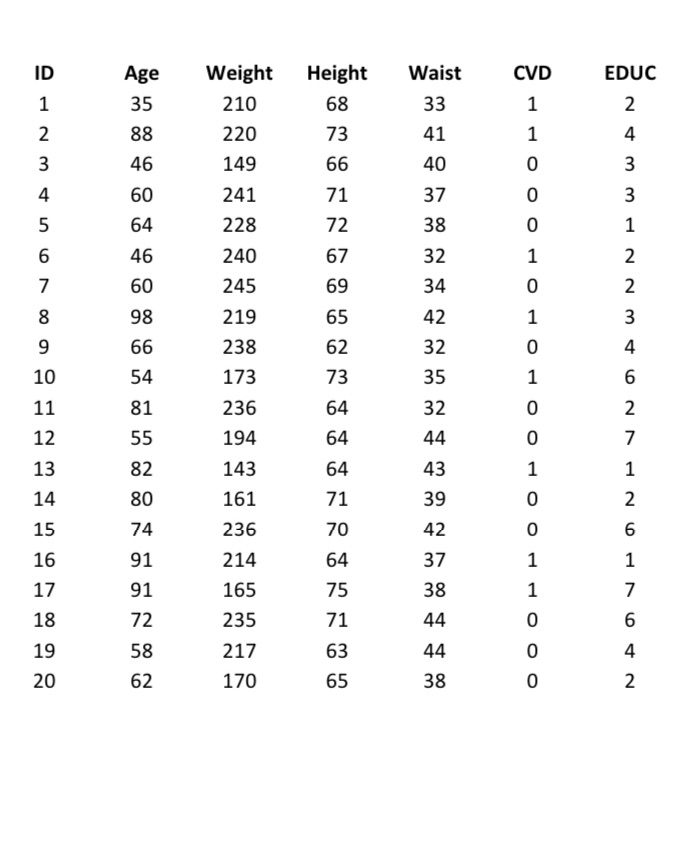
Detailed Histogram Exercise Directions 1. Open the Data Analysis tool found in the Data tab and select Descriptive Statistics. 2. For each variable (except ID), perform the following: a. b. Make sure that \"Labels in first row,\" \"New workbook Ply\" (this will give you a new sheet each time you perform a calculation), and \"Summary statistics\" are checked. For \"Input range,\" highlight the column of the variable you are interested in by selecting the button on that field (it looks like an arrow pointing up with a line under it). This button will collapse the window and allow you to highlight a column, including the variable name (e.g., highlight Age and all the data in that column to include age 62). Once the column is highlighted, select the button on the collapsed window (it looks like an arrow pointing down). The location of the input will appear in the input range field. Select OK. A new workbook sheet should pop up with your descriptive statistics. Make sure the count is 20 (at the bottom of summary statistics). Name this (and other) sheet with the variable name you are evaluating (e.g., Sheet 2 might be changed to Age). Remove the italics from the variable names and bold them; make sure they are centered. Format the output to three decimal places. To do this, do the following: i. Highlight the demographic output. ii. Select Format in the Home tab in the Cells section. iii. Select Format Cells. iv. Select Number as the Category. v. Change the Decimal places field to 3. vi. Select OK. 3. Now you will make a Histogram. Please do the following: In the Data sheet (with the original data), highlight the column with the data. (Do not select one number in the column as was done in the videos, highlight the whole column.) Select the Insert tab and in the Charts section, select Insert Statistic Chart and choose the Histogram option. Right-click any place on the horizontal axis, then select Format Axis in the menu. Select Bin width and change the number to 8. Select the Number of bins and change the number to 6. Select Bin width again and change the number to 6. The histogram should look different. In the Format Axis menu, change the number in Overflow bin to 64. This will show how many people in your sample are 65 years of age or older. Exit the Format Axis menu. Select the histogram. A plus sign will appear on the side of the histogram. Select the plus sign and select Data Labels and Axis Title. On the histogram, double-click the vertical axis and write \"Number of Participants as the title. For the horizontal axis, write \"Age in Years\" as the title. Change the font to size 12 for both titles. Double-click Chart Title and write \"Age Distribution\" as the title; change the font size to 16. . Create a new sheet in your Excel workbook. Rename it \"Histogram.\" (Do this by right clicking the tab and selecting Rename.) Copyright 2023 by University of Phoenix. All rights reserved. Detailed Histogram Exercise Directions NSG/509 v1 Page 2 of 2 Cut and paste your histogram from the Data sheet and place it into the Histogram sheet you just created. You will not need to keep the histogram on the Data sheet. Insert a text box into the Histogram sheet or write your answers the following questions in an empty cell: i. How many participants are > 64 years of age? ii. Looking at this histogram, does this data represent a sample with a normal (bell- shaped) distribution? iii. Does the output for the variable Age support the shape of the Histogram, why or why not? Age Mean 68.150 Standard Error 3.847 Median 65.000 Mode 46.000 Standard Deviation 17.205 Sample Variance 296.029 Kurtosis -0.770 Skewness -0.008 Range 63.000 Minimum 35.000 Maximum 98.000 Sum 1363.000Age Weight Height Waist CVD EDUC 35 210 68 33 88 220 73 41 46 149 66 40 60 241 71 37 64 228 72 38 46 240 67 32 60 245 69 34 98 219 65 42 66 238 62 32 10 54 173 73 35 NAO JHON H J NOA W N NAWWAN 11 81 236 64 32 OOOHHOOHOOHOHOHOOO 12 55 194 64 44 13 82 143 64 43 14 80 161 71 39 15 74 236 70 42 16 91 214 64 37 17 91 165 75 38 18 72 235 71 44 19 58 217 63 44 20 62 170 65 38