

Question: Details Python project #3- pandas, importing data, correl, matplot Please be sure to submit your work to sakal. Please name your python le as yourname_ipynb
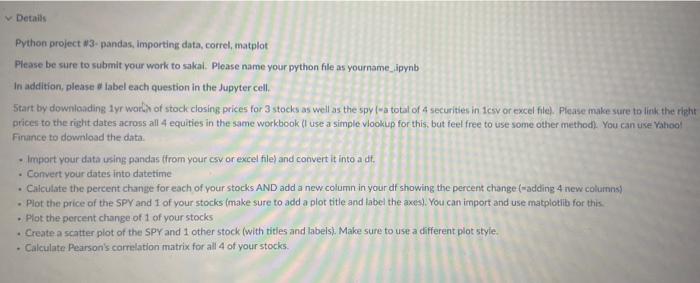
Details Python project #3- pandas, importing data, correl, matplot Please be sure to submit your work to sakal. Please name your python le as yourname_ipynb In addition, please label each question in the Jupyter cell. Start by downloading lyr world of stock closing prices for 3 stocks as well as the spy(a total of 4 securities in tcs or excel file). Please make sure to link the right prices to the right dates across all 4 equities in the same workbook (luse a simple vlookup for this, but feel free to use some other method). You can use Yahool Finance to download the data. Import your data using pandas from your csv or excel file) and convert it into a dt. Convert your dates into datetime . Calculate the percent change for each of your stocks AND add a new column in your df showing the percent change (-adding 4 new columns Plot the price of the SPV and 1 of your stocks (make sure to add a plot title and label the axes). You can import and use matplotlib for this Plot the percent change of 1 of your stocks Create a scatter plot of the SPY and 1 other stock (with titles and labels). Make sure to use a different plot style. - Calculate Pearson's correlation matrix for all 4 of your stocks Details Python project #3- pandas, importing data, correl, matplot Please be sure to submit your work to sakal. Please name your python le as yourname_ipynb In addition, please label each question in the Jupyter cell. Start by downloading lyr world of stock closing prices for 3 stocks as well as the spy(a total of 4 securities in tcs or excel file). Please make sure to link the right prices to the right dates across all 4 equities in the same workbook (luse a simple vlookup for this, but feel free to use some other method). You can use Yahool Finance to download the data. Import your data using pandas from your csv or excel file) and convert it into a dt. Convert your dates into datetime . Calculate the percent change for each of your stocks AND add a new column in your df showing the percent change (-adding 4 new columns Plot the price of the SPV and 1 of your stocks (make sure to add a plot title and label the axes). You can import and use matplotlib for this Plot the percent change of 1 of your stocks Create a scatter plot of the SPY and 1 other stock (with titles and labels). Make sure to use a different plot style. - Calculate Pearson's correlation matrix for all 4 of your stocks
Step by Step Solution
There are 3 Steps involved in it

Get step-by-step solutions from verified subject matter experts