

Question: DETAILS You may need to use the appropriate appendix table or technology to answer this question. MY NOTE Independent random samples taken on two university
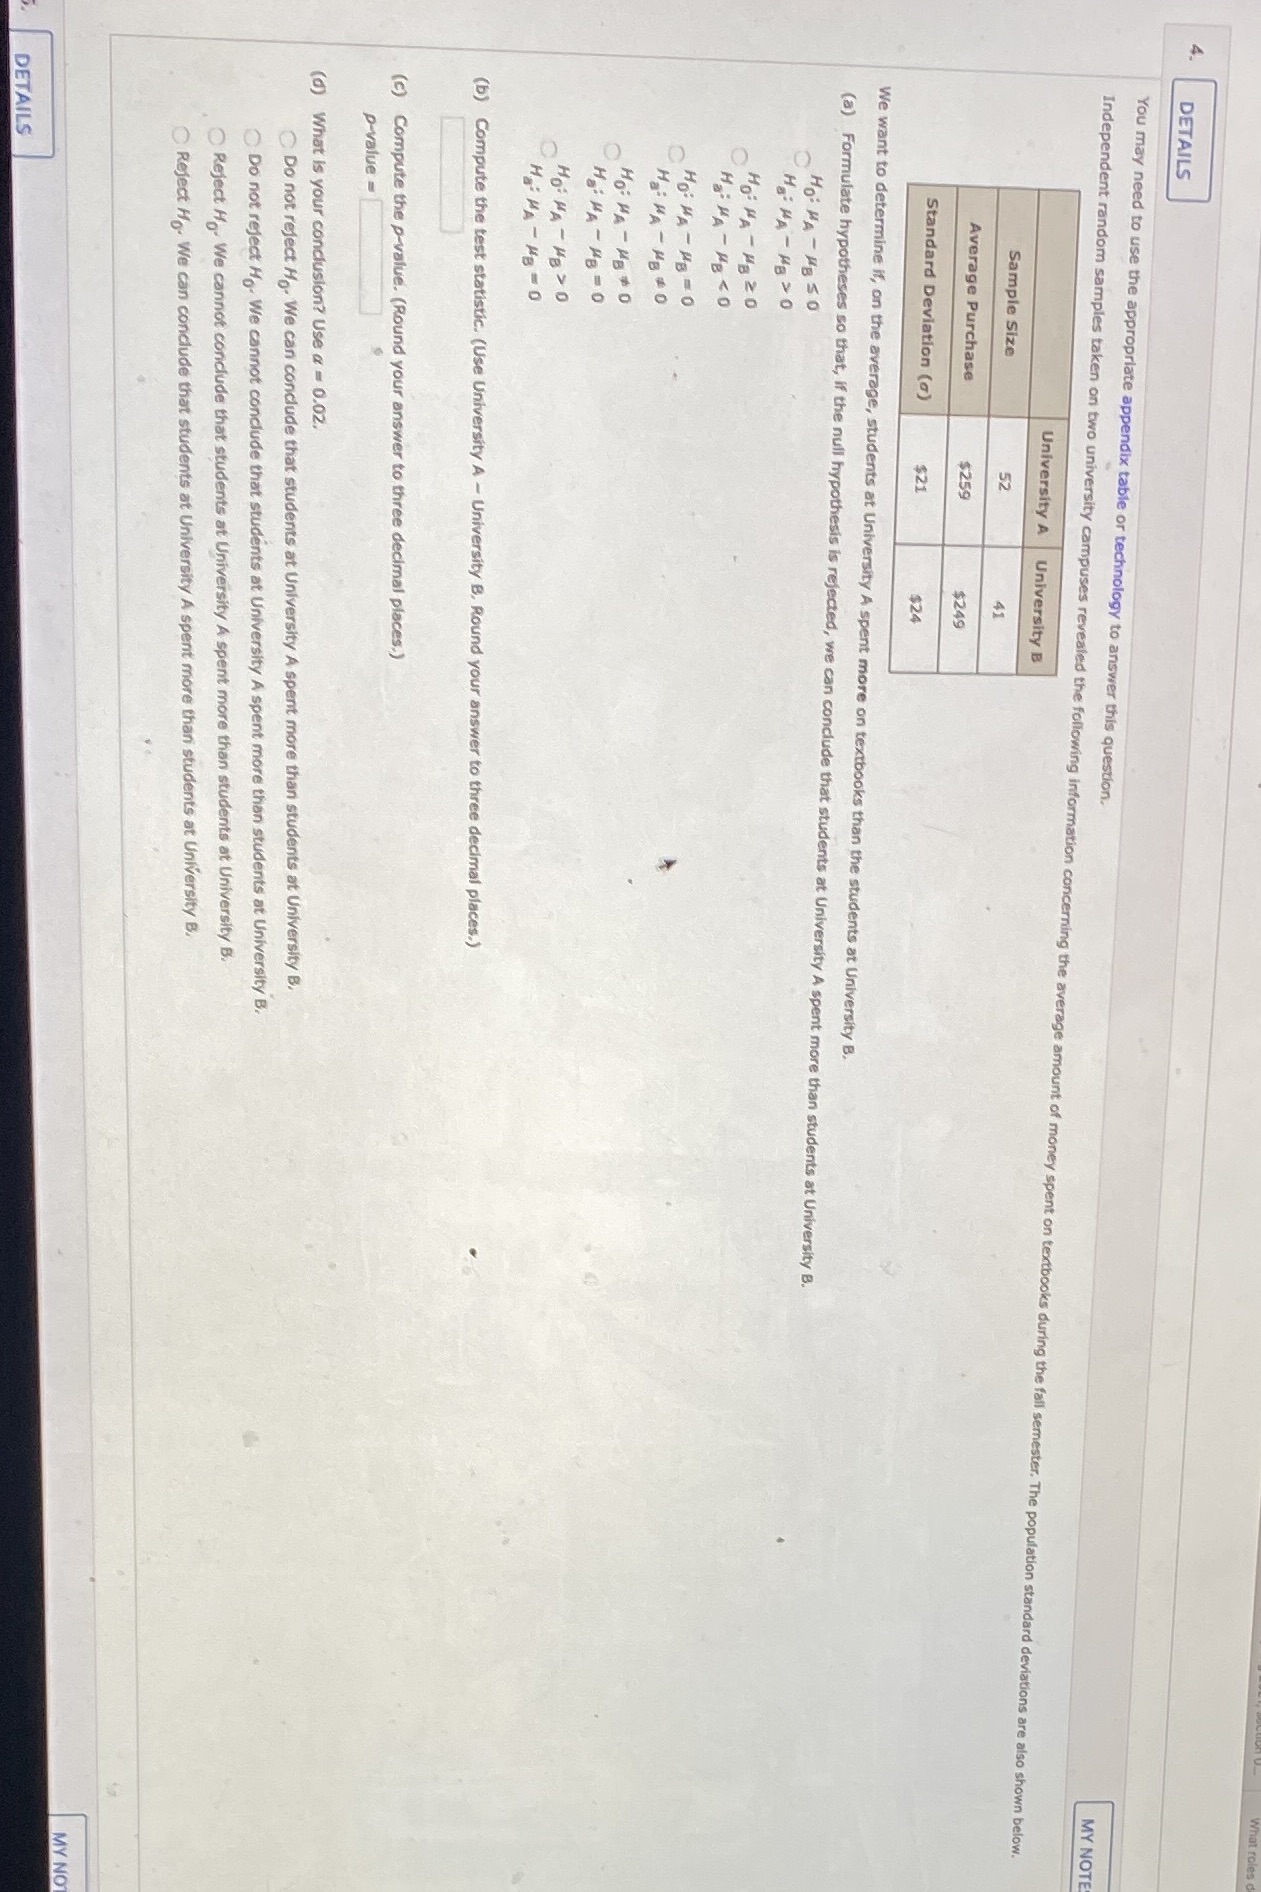

DETAILS You may need to use the appropriate appendix table or technology to answer this question. MY NOTE Independent random samples taken on two university campuses revealed the following information concerning the average amount of money spent on textbooks during the fall semester. The population standard deviations are also shown below. University A University B Sample Size 52 Average Purchase $259 $249 Standard Deviation (6) $21 $24 We want to determine if, on the average, students at University A spent more on textbooks than the students at University B. (a) Formulate hypotheses so that, if the null hypothesis is rejected, we can conclude that students at University A spent more than students at University B. HO: HA - HB SO OH : HA - HB > O HO: HA - H8 20 OH: HA - HB CO HO: HA - HB = 0 HiHA - HB * 0 HO :HA - HBO Hi HA - HB = 0 HO: HA - HB > 0 OH : HA - HB = 0 (b) Compute the test statistic. (Use University A - University B, Round your answer to three decimal places.) (c) Compute the p-value. (Round your answer to three decimal places.) p-value = (d) What is your conclusion? Use a = 0.02. Do not reject Ho. We can conclude that students at University A spent more than students at University B. Do not reject Ho. We cannot conclude that students at University A spent more than students at University B. Reject Ho. We cannot conclude that students at University A spent more than students at University B. Reject Ho. We can conclude that students at University A spent more than students at University B. MY NO DETAILS
Step by Step Solution
There are 3 Steps involved in it

Get step-by-step solutions from verified subject matter experts