

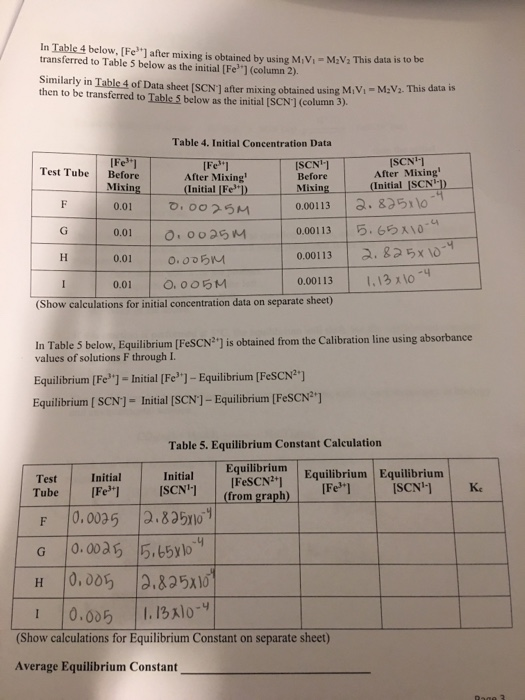
In Table 4 below, [Fe] after mixing is obtained by using MV-MV This data is to...
Fantastic news! We've Found the answer you've been seeking!
Question:
Transcribed Image Text:
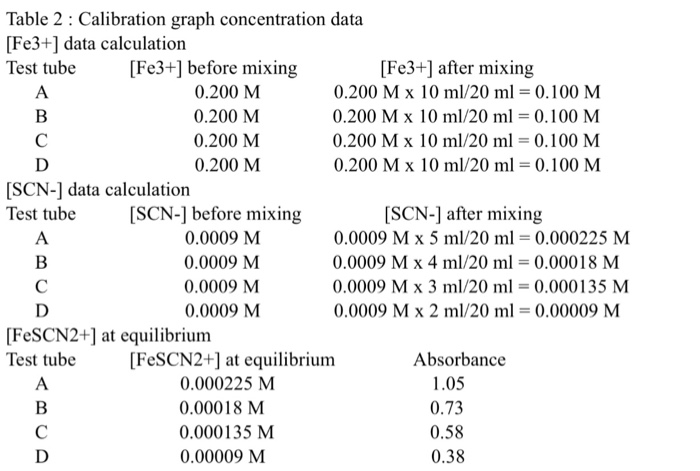
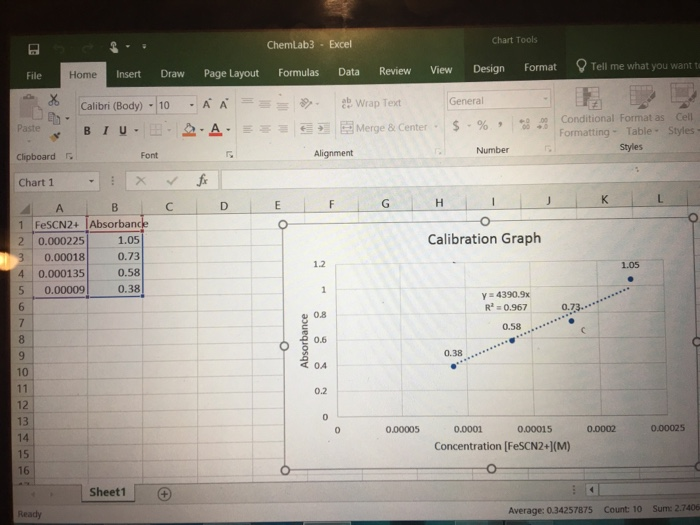
In Table 4 below, [Fe] after mixing is obtained by using M₁V₁-M₂V₂ This data is to be transferred to Table 5 below as the initial [Fe³"] (column 2). Similarly in Table 4 of Data sheet [SCN] after mixing obtained using M₁V₁-M₂V₂. This data is then to be transferred to Table 5 below as the initial [SCN] (column 3). Test Tube [Fe] After Mixing (Initial [Fe]) 0.0025M 0.0025M 0.005M 0.00113 I 0.01 0.005M (Show calculations for initial concentration data on separate sheet) Test Tube F F G G H H [Fe] Before Mixing 0.01 0.01 0.01 Table 4. Initial Concentration Data [SCN¹-] Before Mixing 0.00113 0.00113 0.00113 In Table 5 below, Equilibrium [FeSCN²] is obtained from the Calibration line using absorbance values of solutions F through I. Equilibrium [Fe] Initial [Fe³+] - Equilibrium [FeSCN²¹] Equilibrium [SCN] = Initial [SCN] - Equilibrium [FeSCN²¹] Initial [SCN¹-] 0.0025 2.825x10 0.0025 5.65x10⁴ 0.005 I 0.005 (Show calculations for Equilibrium Constant on separate sheet) Average Equilibrium Constant Initial [Fe³+] [SCN¹-] After Mixing (Initial [SCN¹1) 2.825x10 2.825x10 1.13x10⁻⁴ 5.65x10⁻⁴ 2.825х 10-4 1.13 x 10⁻⁴ Table 5. Equilibrium Constant Calculation Equilibrium [FeSCN²+] (from graph) Equilibrium Equilibrium [Fe³] [SCN¹-] Ke Rage 3 Table 2: Calibration graph concentration data [Fe3+] data calculation Test tube [Fe3+] before mixing 0.200 M 0.200 M 0.200 M 0.200 M A B C D [SCN-] data calculation Test tube A B C D [SCN-] before mixing 0.0009 M 0.0009 M 0.0009 M 0.0009 M A B C D [FeSCN2+] at equilibrium Test tube [Fe3+] after mixing 0.200 M x 10 ml/20 ml = 0.100 M 0.200 M x 10 ml/20 ml = 0.100 M 0.200 M x 10 ml/20 ml = 0.100 M 0.200 M x 10 ml/20 ml = 0.100 M [SCN-] after mixing 0.0009 M x 5 ml/20 ml = 0.000225 M 0.0009 M x 4 ml/20 ml = 0.00018 M 0.0009 M x 3 ml/20 ml = 0.000135 M 0.0009 M x 2 ml/20 ml = 0.00009 M [FeSCN2+] at equilibrium 0.000225 M 0.00018 M 0.000135 M 0.00009 M Absorbance 1.05 0.73 0.58 0.38 Paste File Clipboard Chart 1 4 5 * 6 7 2 0.000225 3 0.00018 0.000135 0.00009 8 9 10 11 12 13 14 15 16 Home Insert Draw Ready Calibri (Body) -10 BIU- A B 1 FeSCN2+ Absorbance Y 1 Font X Sheet1 1.05 0.73 0.58 0.38 C Page Layout A A A fx D ChemLab3 Excel Formulas E O Absorbance 1.2 Alignment 1 0.8 0.6 0.4 0.2 F Data 0 Ce 0 Review Wrap Text Merge & Center - G 0.00005 View Design H General $-% Chart Tools 0.38 Number 1 Format Calibration Graph 60 Conditional Format as Cell 000 Formatting Table Styles- Styles y=4390.9x R² = 0.967 0.58 0.7 Tell me what you want to 0.00015 0.0001 Concentration [FeSCN2+](M) K 0.0002 1.05 ● B Average: 0.34257875 Count: 10 0.00025 Sum: 2.7406 In Table 4 below, [Fe] after mixing is obtained by using M₁V₁-M₂V₂ This data is to be transferred to Table 5 below as the initial [Fe³"] (column 2). Similarly in Table 4 of Data sheet [SCN] after mixing obtained using M₁V₁-M₂V₂. This data is then to be transferred to Table 5 below as the initial [SCN] (column 3). Test Tube [Fe] After Mixing (Initial [Fe]) 0.0025M 0.0025M 0.005M 0.00113 I 0.01 0.005M (Show calculations for initial concentration data on separate sheet) Test Tube F F G G H H [Fe] Before Mixing 0.01 0.01 0.01 Table 4. Initial Concentration Data [SCN¹-] Before Mixing 0.00113 0.00113 0.00113 In Table 5 below, Equilibrium [FeSCN²] is obtained from the Calibration line using absorbance values of solutions F through I. Equilibrium [Fe] Initial [Fe³+] - Equilibrium [FeSCN²¹] Equilibrium [SCN] = Initial [SCN] - Equilibrium [FeSCN²¹] Initial [SCN¹-] 0.0025 2.825x10 0.0025 5.65x10⁴ 0.005 I 0.005 (Show calculations for Equilibrium Constant on separate sheet) Average Equilibrium Constant Initial [Fe³+] [SCN¹-] After Mixing (Initial [SCN¹1) 2.825x10 2.825x10 1.13x10⁻⁴ 5.65x10⁻⁴ 2.825х 10-4 1.13 x 10⁻⁴ Table 5. Equilibrium Constant Calculation Equilibrium [FeSCN²+] (from graph) Equilibrium Equilibrium [Fe³] [SCN¹-] Ke Rage 3 Table 2: Calibration graph concentration data [Fe3+] data calculation Test tube [Fe3+] before mixing 0.200 M 0.200 M 0.200 M 0.200 M A B C D [SCN-] data calculation Test tube A B C D [SCN-] before mixing 0.0009 M 0.0009 M 0.0009 M 0.0009 M A B C D [FeSCN2+] at equilibrium Test tube [Fe3+] after mixing 0.200 M x 10 ml/20 ml = 0.100 M 0.200 M x 10 ml/20 ml = 0.100 M 0.200 M x 10 ml/20 ml = 0.100 M 0.200 M x 10 ml/20 ml = 0.100 M [SCN-] after mixing 0.0009 M x 5 ml/20 ml = 0.000225 M 0.0009 M x 4 ml/20 ml = 0.00018 M 0.0009 M x 3 ml/20 ml = 0.000135 M 0.0009 M x 2 ml/20 ml = 0.00009 M [FeSCN2+] at equilibrium 0.000225 M 0.00018 M 0.000135 M 0.00009 M Absorbance 1.05 0.73 0.58 0.38 Paste File Clipboard Chart 1 4 5 * 6 7 2 0.000225 3 0.00018 0.000135 0.00009 8 9 10 11 12 13 14 15 16 Home Insert Draw Ready Calibri (Body) -10 BIU- A B 1 FeSCN2+ Absorbance Y 1 Font X Sheet1 1.05 0.73 0.58 0.38 C Page Layout A A A fx D ChemLab3 Excel Formulas E O Absorbance 1.2 Alignment 1 0.8 0.6 0.4 0.2 F Data 0 Ce 0 Review Wrap Text Merge & Center - G 0.00005 View Design H General $-% Chart Tools 0.38 Number 1 Format Calibration Graph 60 Conditional Format as Cell 000 Formatting Table Styles- Styles y=4390.9x R² = 0.967 0.58 0.7 Tell me what you want to 0.00015 0.0001 Concentration [FeSCN2+](M) K 0.0002 1.05 ● B Average: 0.34257875 Count: 10 0.00025 Sum: 2.7406
Expert Answer:

Related Book For 
Fundamentals of Analytical Chemistry
ISBN: 978-0495558286
9th edition
Authors: Douglas A. Skoog, Donald M. West, F. James Holler, Stanley R. Crouch
Posted Date:
Students also viewed these chemistry questions
-
The revenues of Amazon are shown in Table 5 for various years. Table 5 Annual Revenues of Amazon YearRevenue (billions of dollars) 2001 .. 3.12 2003 .. 5.26 2005 .. 8.49 2007 ..14.84 2009 ..24.51...
-
The equilibrium constant Kc for the equation at 425oC is 1.84. What is the value of Kc for the following equation? 2H1(g) H2(g) + I2(g) H2(g) 12g)2HI(g)
-
The equilibrium constant Kc for the equation at 900oC is 27.8. What is the value of Kc for the following equation? CS2(g) 4H2(g) CH4(g) 2H2S(g) ICH4(g) + H2S(g) CS2(g) + 2H2(g)
-
Is CSCH3CO2 ionic or covalent ? Name it QUESTION 7 Is rubidium dichromate ionic or covalent ? Write its formula QUESTION 8 s copper m suhde soric or covaent write its formula QUESTION 9 Is vanadium...
-
Prices of zero-coupon, default-free securities with face values of $1000 are summarized in the following table: Suppose you observe that a three-year, default-free security with an annual coupon rate...
-
Company A provided 500 hours of its time to company B in exchange for 1,000 shares of company B $5 par common stock. Billing rate is $700 per hour, and company B stock has a book value of $250 per...
-
Discuss the sampling strategy and technique to be used. Develop a hypothetical research scenario that would necessitate the use of the Action Research Approach and a Posttest With a Historical...
-
Placid Lake Corporation acquired 80 percent of the outstanding voting stock of Scenic, Inc., on January 1, 2014, when Scenic had a net book value of $400,000. Any excess fair value was assigned to...
-
Solve the following DES. a) y (4) - (3) -3y"+5y'-2y=0
-
B. Complete the sentences with the correct for of SER or ESTAR in the present or infinitive verb tense . 1. My cousins from Guadalajara, Mexico. 2. How (you)? I'm fine today. 3. Where are the black...
-
Compute the maximum displacement for the wooden cantilever beam that has the cross section shown. Use E = 10 GPa for wood. 2 kN/m 75 mm !!!! -- 150 mm 3 m FIG. P6.57 0.8 kN/m A B
-
Which branch of government has recently increased land and water rights for Native Americans? Explain
-
A document that is issued by upper management and provides the project manager with written authority to use organizational resources for project activities is called?
-
A restaurant noted what type of food its customers ordered last week. Here are the results: Find the probability that a randomly chosen customer ordered a burger given that they ordered fries.
-
7. Explain the difference between the following three C function prototypes: void f(int n); extern void f(int n); static void f(int n);
-
The information of expected returns, betas, specific standard deviations of three assets, and their proportions in a portfolio is in the following table: Assets Expected return (%) Beta Specified...
-
A portfolio has three stocks: Stock A, Stock B, and Stock C. Stock A has a return of 16.88%. Stock B has a return of 22.49%. The weight of Stock A in the portfolio is 30%. The weight of stock B in...
-
Dawson Companys balance sheet information at the end of 2019 and 2020 is as follows: Additional information: The company did not issue any common stock during 2020. Required : Next Level Fill in the...
-
Sea water contains an average of 1.08 x 10³ ppm of Na+ and 270 ppm of SO42-. Calculate (a) The molar concentrations of Na+ and SO42- given that the average density of sea water is 1.02 g / mL. (b)...
-
Calculate the relative standard deviation in the computed molar concentration of 0.0200 M HCl if this acid was standardized against the masses found in Example 16-1 for (a) TRIS, (b) Na2CO3, and (c)...
-
Supply the missing data in the table below. Molar Analytical Concentration, Cr Lactic Iodic Butanoic Hypochlorous 0.280 7.00 Nitrous Hydrogen .120 _ 0.200 , 0.640 0.765 5.00 0.644_ __ _0.105 0.413...
-
Andrew, a final year part-time MBA student employed by a large Maltese market research company, read in a local newspaper that Malta (a small island state situated in the centre of the Mediterranean...
-
Maria had a problem. The research proposal for her masters research project was due. But she had no idea what to research. Sustainable tourism had been her favourite module on the programme and...
-
Visit the Research Ethics Guidebook at www.ethicsguidebook.ac.uk and browse through the sections of this guide. In relation to the context of your proposed research project, make a note of points...

Study smarter with the SolutionInn App