

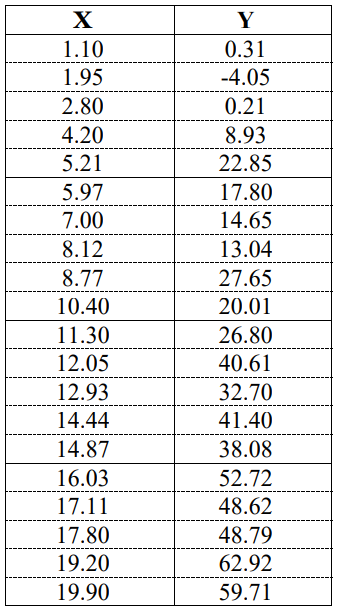
Question: Determine by plotting uncertainty bars if any of the data points should be excluded from the function determination. The uncertainty in the x-values is 5%
Determine by plotting uncertainty bars if any of the data points should be excluded from the function determination. The uncertainty in the x-values is 5% and the uncertainty in the y-values is 10%. Determine with the appropriate statistical parameter whether this is an acceptable determination. The answer must also contain a graph with data points, uncertainty bars and fitted function as well as an equation expression
Step by Step Solution
There are 3 Steps involved in it
1 Expert Approved Answer
Step: 1 Unlock

Question Has Been Solved by an Expert!
Get step-by-step solutions from verified subject matter experts
Step: 2 Unlock
Step: 3 Unlock