

Question: Determine if there is a significant positive correlation between the sets of data at a 10% significance level. x Y 98 115 103 113 96

![72 Criticawalueww :] [three decimal accuracy] Testsmisticwws :] [three decimal accuracy] Test](https://s3.amazonaws.com/si.experts.images/answers/2024/06/6674991b15392_4026674991aec249.jpg)
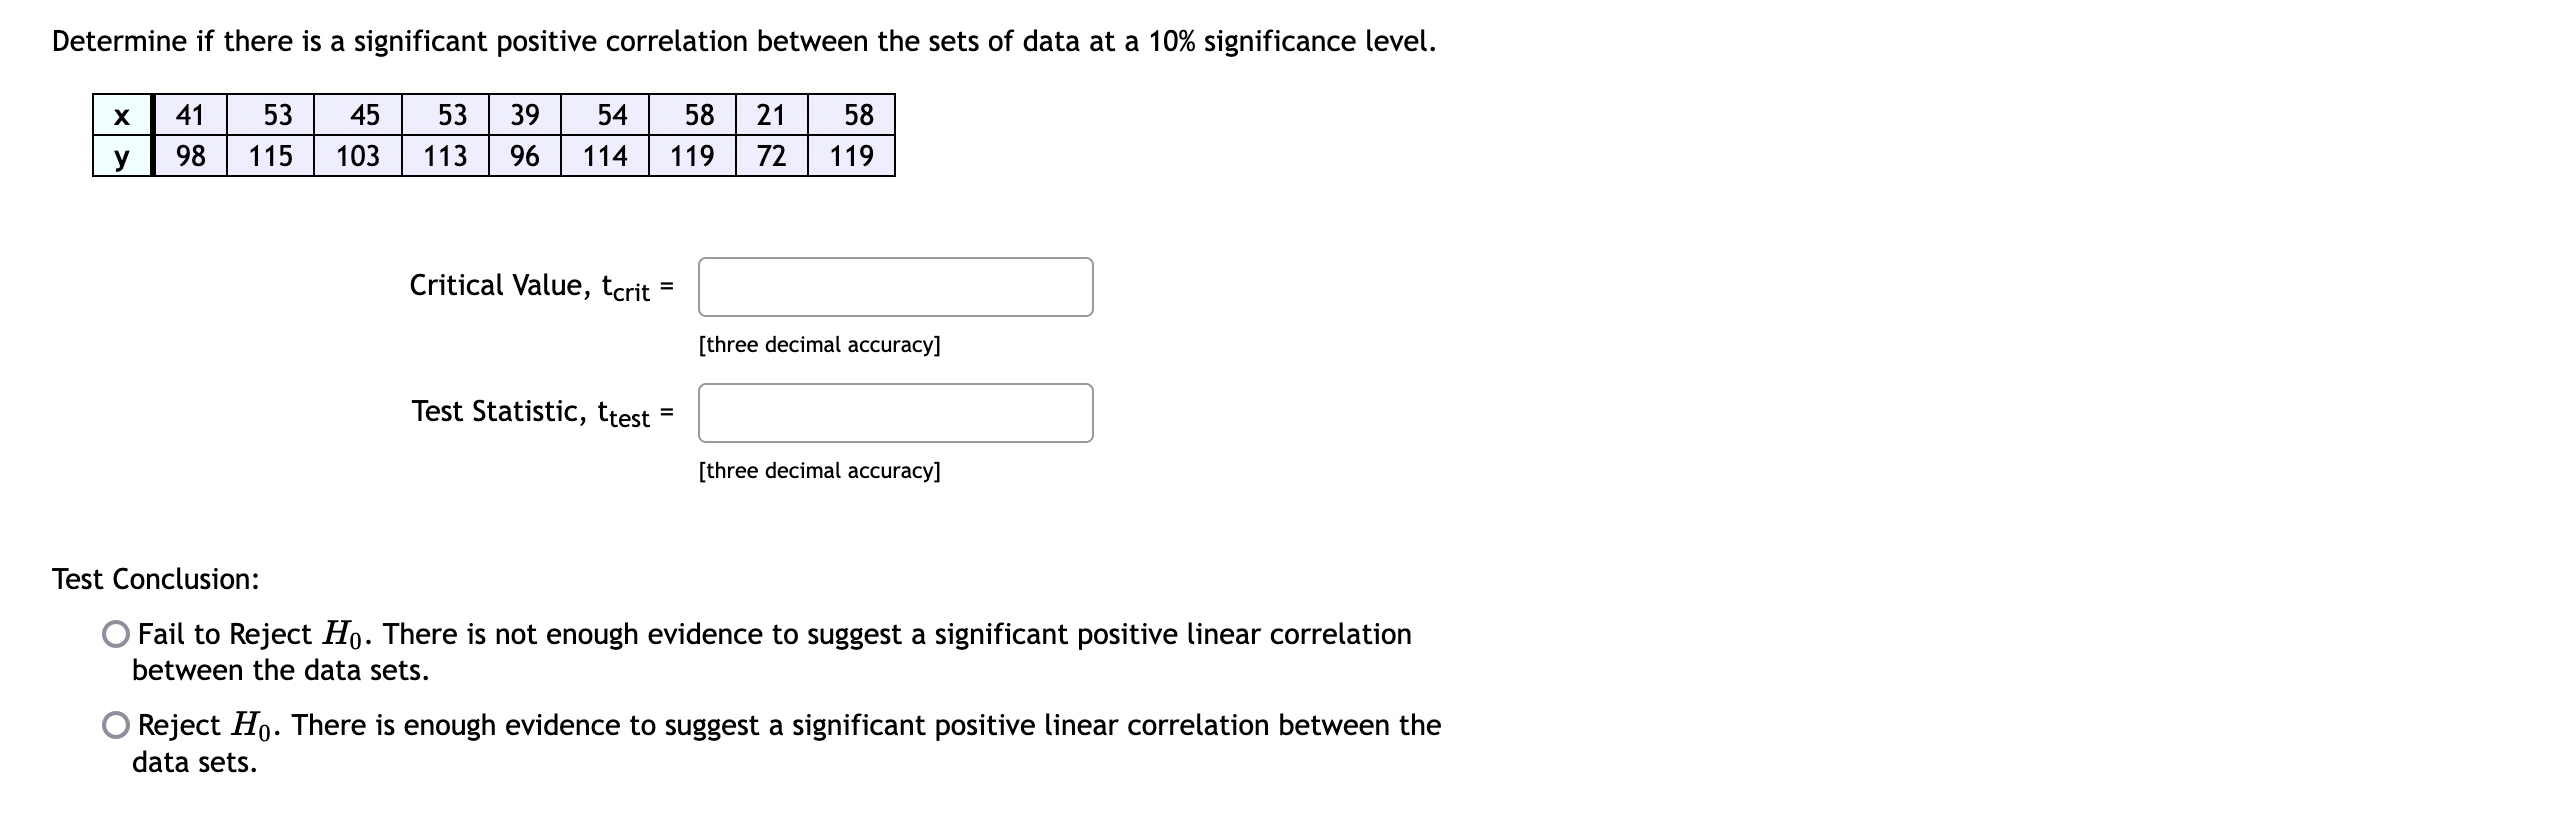


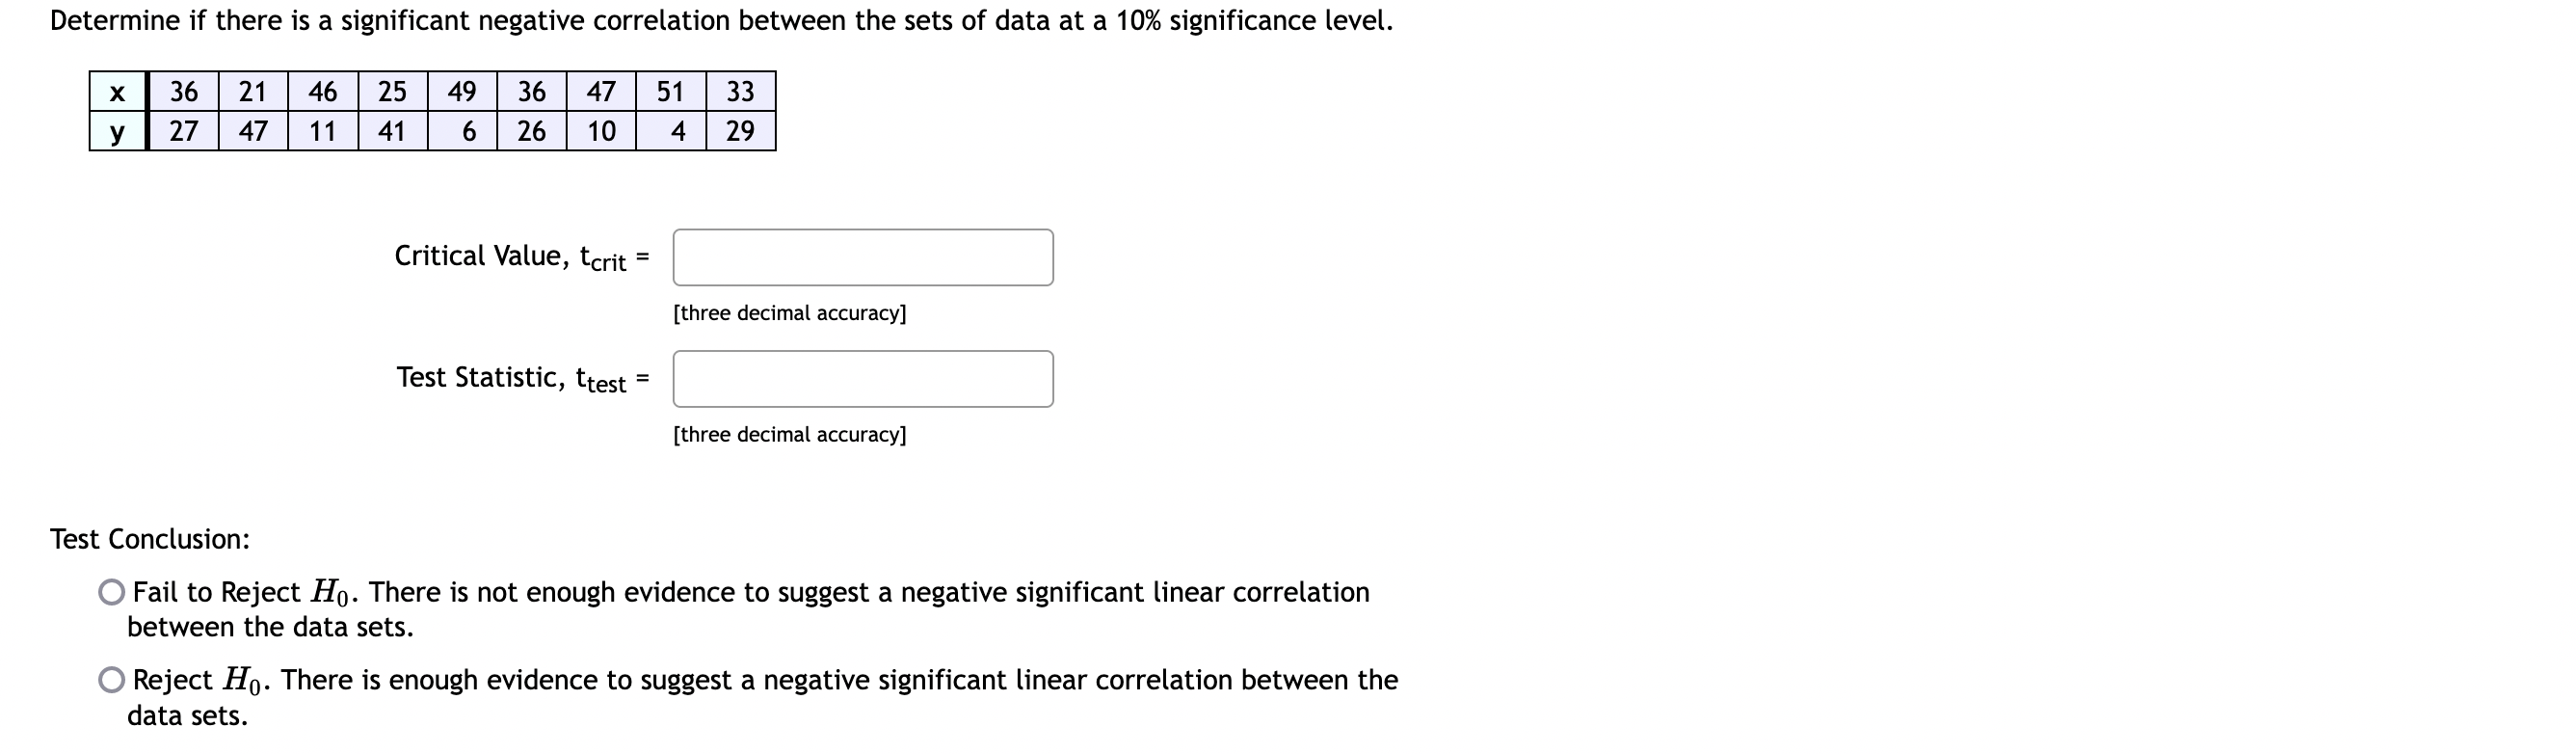
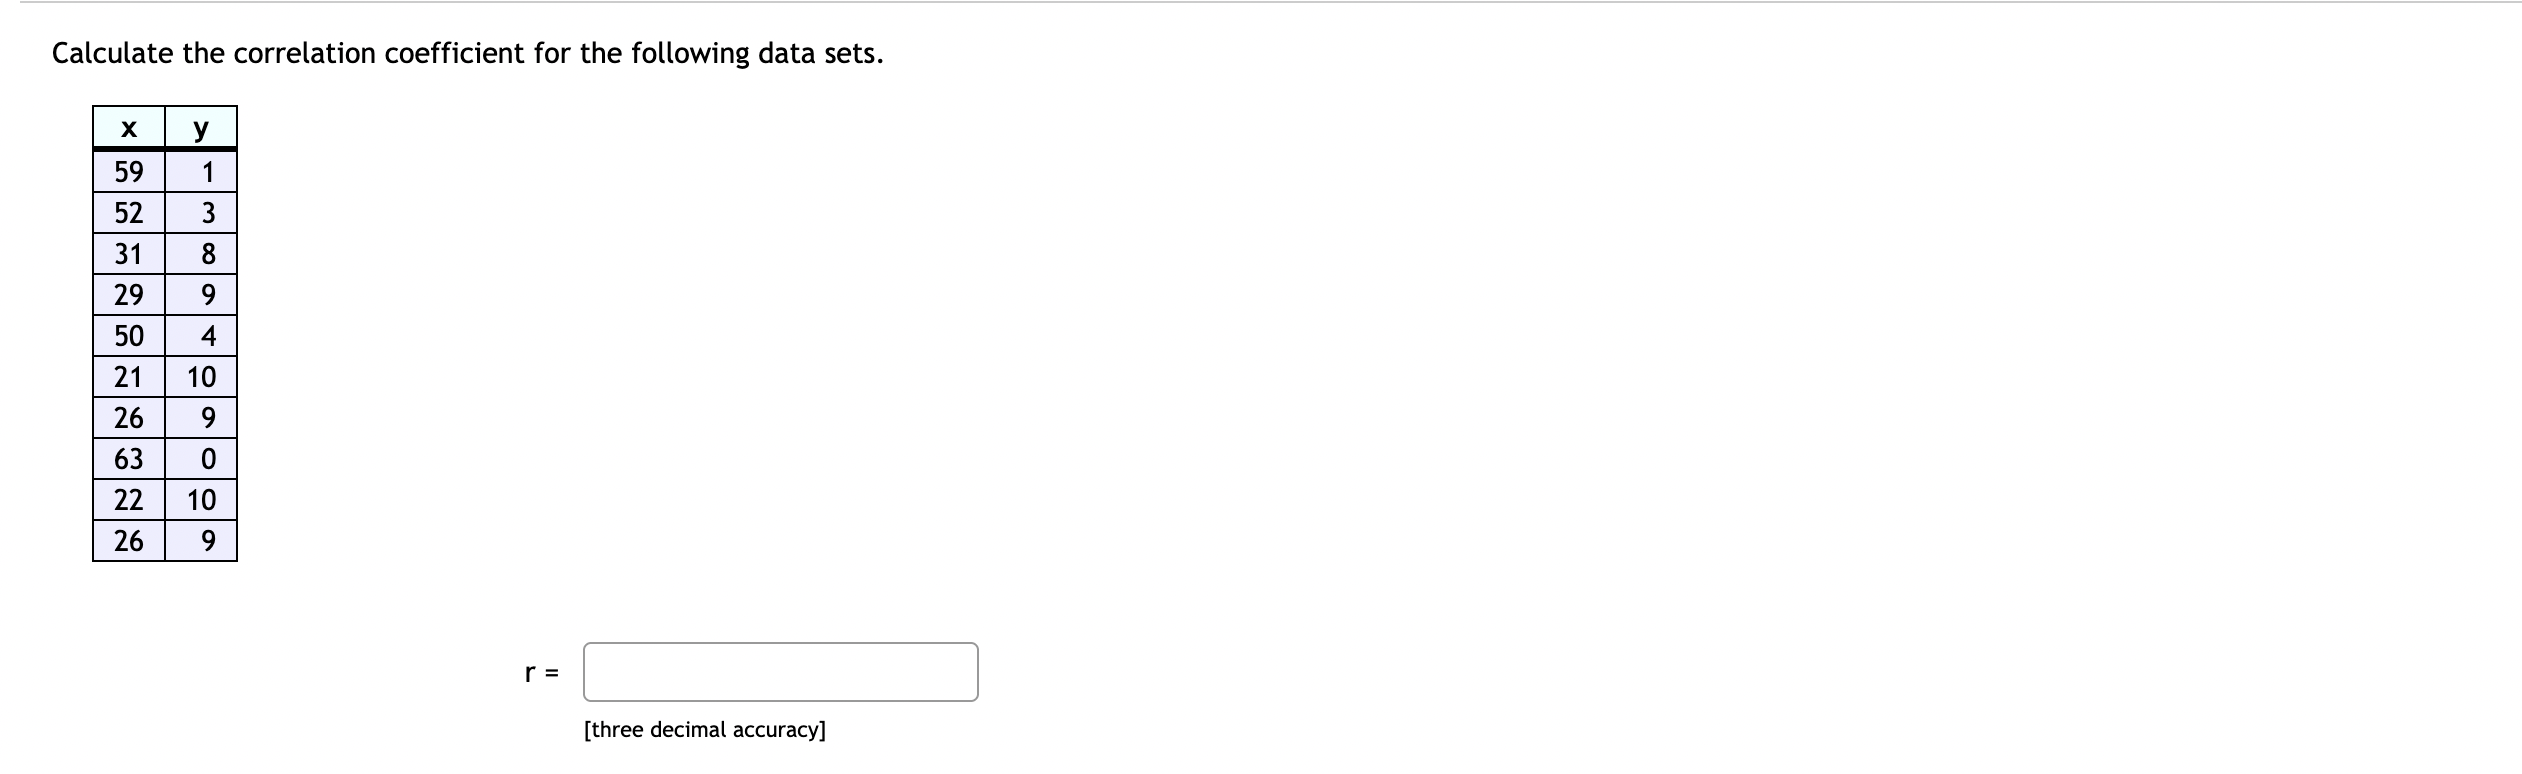
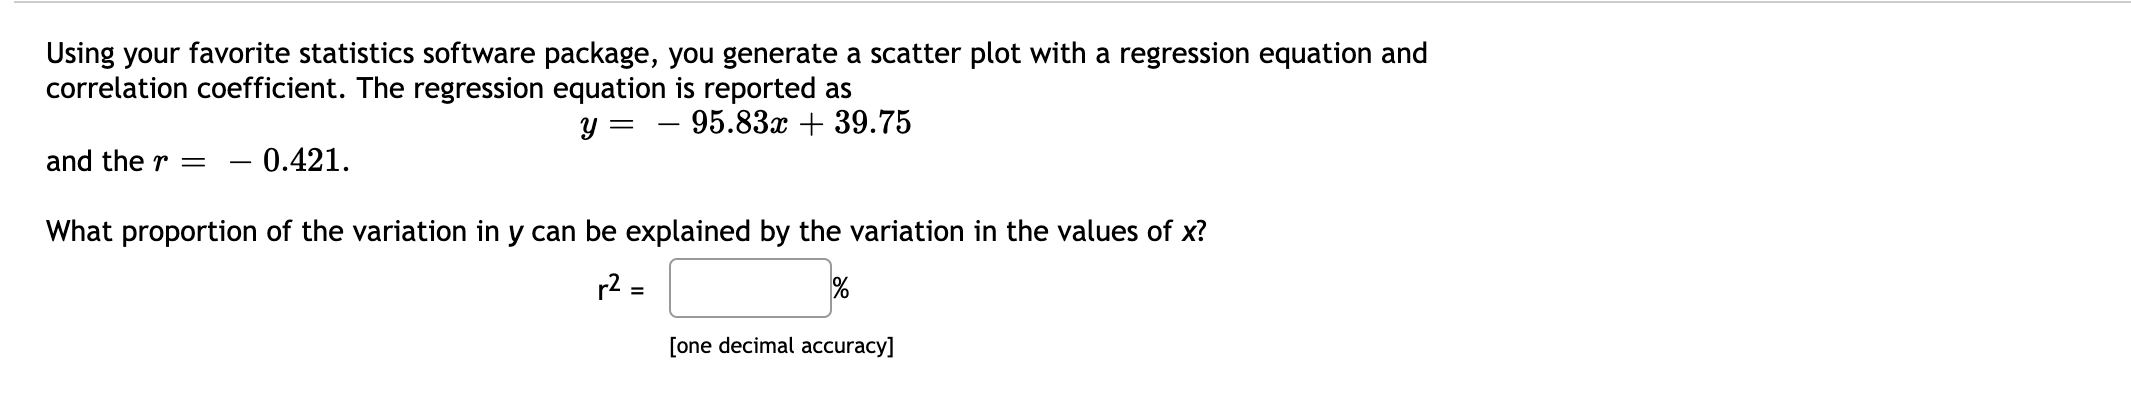
Determine if there is a significant positive correlation between the sets of data at a 10% significance level. x Y 98 115 103 113 96 114 119 119 41 53 45|53 39 54 58|21 58 72 Criticawalueww :] [three decimal accuracy] Testsmisticwws :] [three decimal accuracy] Test Conclusion: 0 Fail to Reject Ho. There is not enough evidence to suggest a significant positive linear correlation between the data sets. 0 Reject H0. There is enough evidence to suggest a significant positive linear correlation between the data sets. Calculate the correlation coefficient for the following data sets. X y 59 52 3 31 8 29 9 50 4 21 10 26 9 63 0 22 10 26 9 r = [three decimal accuracy]Using your favorite statistics software package, you generate a scatter plot with a regression equation and correlation coefficient. The regression equation is reported as y = 95.8330 + 39.75 and the 'r = 0.421. What proportion of the variation in y can be explained by the variation in the values of x? [one decimal accuracy] Determine if there is a significant negative correlation between the sets of data at a 10% significance level. x 36 2146 25 49 36 47 5133 y2747114162610 429 criticawalue'w :] [three decimal accuracy] TestStau-sac,tm= :] [three decimal accuracy] Test Conclusion: 0 Fail to Reject H0. There is not enough evidence to suggest a negative significant linear correlation between the data sets. 0 Reject H0. There is enough evidence to suggest a negative significant linear correlation between the data sets
Step by Step Solution
There are 3 Steps involved in it

Get step-by-step solutions from verified subject matter experts