

Question: Determine its equilibrium solution(s), draw the corresponding phase diagram, and obtain its general solution. (c) For a general value of t, we can't use the
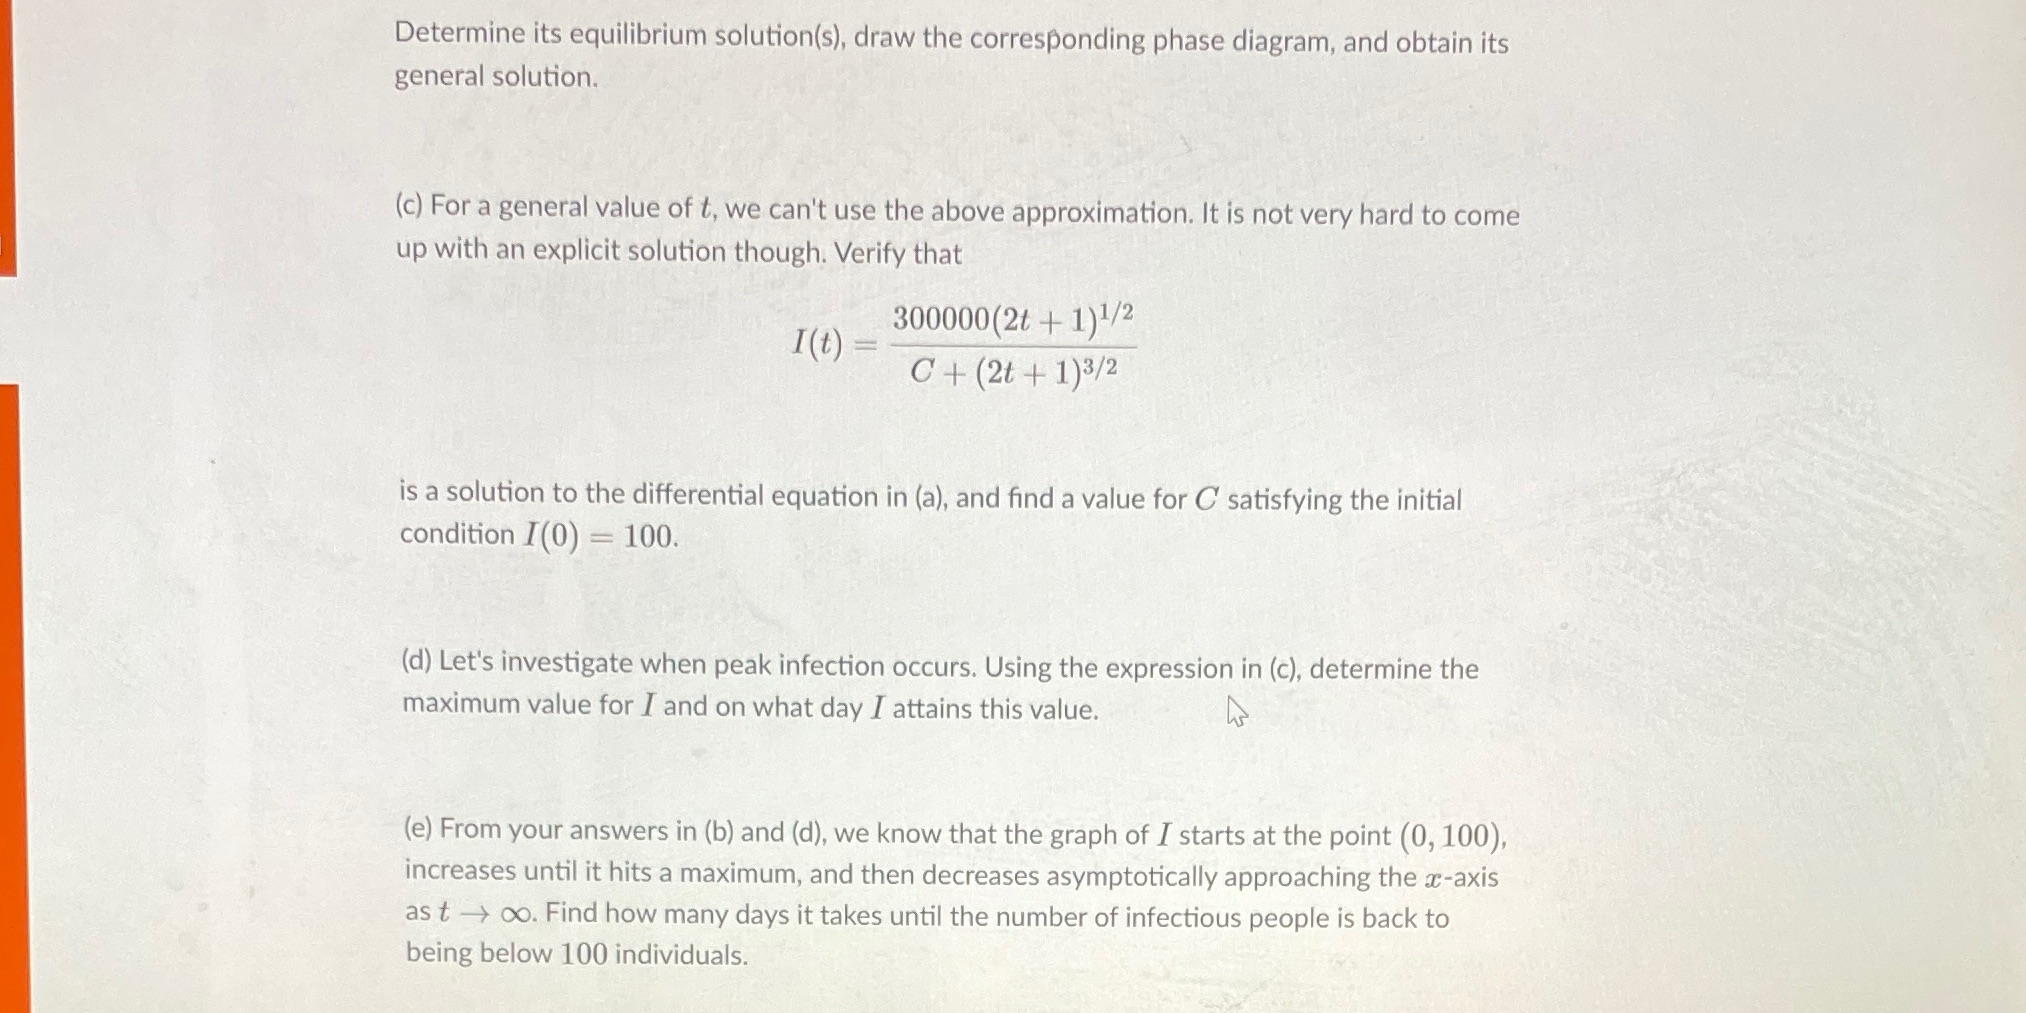
Determine its equilibrium solution(s), draw the corresponding phase diagram, and obtain its general solution. (c) For a general value of t, we can't use the above approximation. It is not very hard to come up with an explicit solution though. Verify that I(t) = 300000(2t + 1)1/2 C + (2t + 1)3/2 is a solution to the differential equation in (a), and find a value for C' satisfying the initial condition I(0) = 100. (d) Let's investigate when peak infection occurs. Using the expression in (c), determine the maximum value for I and on what day I attains this value. (e) From your answers in (b) and (d), we know that the graph of I starts at the point (0, 100), increases until it hits a maximum, and then decreases asymptotically approaching the ac-axis as t -> co. Find how many days it takes until the number of infectious people is back to being below 100 individuals
Step by Step Solution
There are 3 Steps involved in it

Get step-by-step solutions from verified subject matter experts