

Question: Determine the following descriptive statistics. In order to do so, Click Descriptives, drag Mischief to variables and Cloak to the split option. This provides you
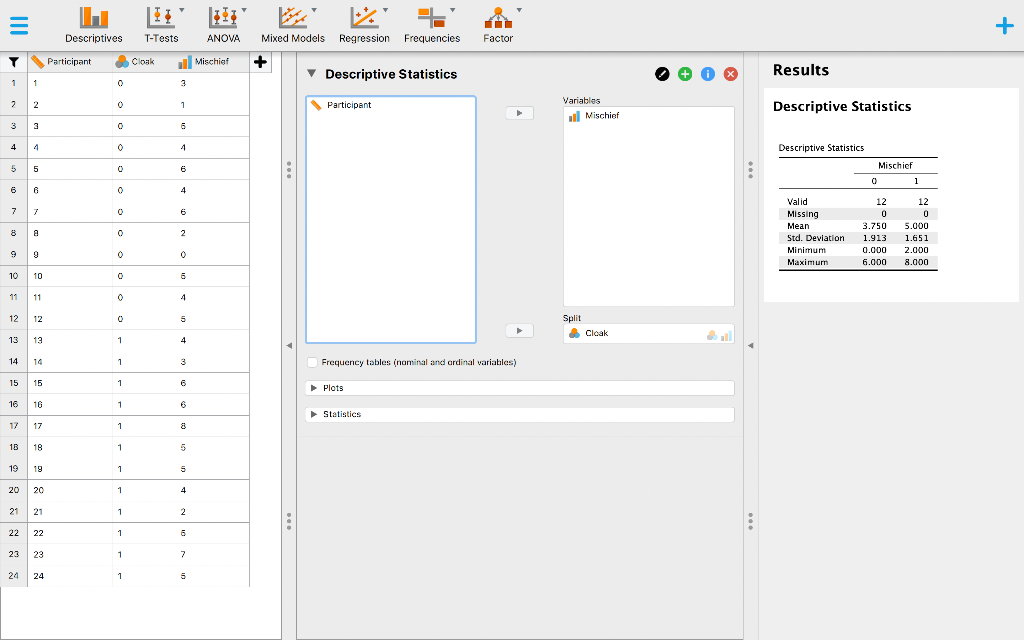
Determine the following descriptive statistics. In order to do so, Click Descriptives, drag Mischief to variables and Cloak to the split option. This provides you with descriptives for those labeled 0 (no cloak) and 1 (cloak).
No Invisibility Cloak Invisibility Cloak
N = _________ n = ________
Mean = _________ acts Mean = _________ acts
s = _________ acts s = _________ acts
Ignore the independent samples test provided automatically when you open the data set and instead run a single sample t-test on the Mischief variable to determine at a = 0.05, is there a significant difference in acts committed while wearing an invisibility cloak compared to the general population.
(Click the pull down arrow next to T-Test One Sample T-Test Select Mischief from the variable list and drag or click to arrow to place it in the test column on the right)
*Please also select the additional statistic of Effect Size and ensure that you are using the correct null hypothesis (is this one-tailed or two, directional or non-directional?)
Write the results of this analysis in APA format: ____________________________________________
What does this mean?
Provide the estimate of effect size (Cohens D) or provide an argument why it would not be appropriate:
10 Factor + Descriptives T-Tests ANOVA Mixed Models Regression Frequencies + Descriptive Statistics Participant Cloak Mischief Results 1 1 3 2 2 1 Participant Variables Mischief Descriptive Statistics 3 3 6 4 4 O 4 Descriptive Statistics 5 5 6 6 6 6 0 4 7. 7 6 Mischief 0 1 1 12 12 0 0 3.750 5.000 1.913 1.651 0.000 2.000 6.000 8.000 8 e 0 Valid Missing Mean Std. Deviation Minimum Maximum 2 9 9 0 0 10 10 0 6 11 11 O 4 12 12 5 Split Cloak 13 12 1 4 4 14 14 1 1 3 Frequency tables (nominal and ordinal variables) 15 15 1 6 Plats 16 16 1 6 Statistics 17 17 1 8 1B 18 1 5 19 19 1 5 20 20 1 4 21 21 1 1 2 : 22 22 1 6 23 23 1 7 24 24 1 5 10 Factor + Descriptives T-Tests ANOVA Mixed Models Regression Frequencies + Descriptive Statistics Participant Cloak Mischief Results 1 1 3 2 2 1 Participant Variables Mischief Descriptive Statistics 3 3 6 4 4 O 4 Descriptive Statistics 5 5 6 6 6 6 0 4 7. 7 6 Mischief 0 1 1 12 12 0 0 3.750 5.000 1.913 1.651 0.000 2.000 6.000 8.000 8 e 0 Valid Missing Mean Std. Deviation Minimum Maximum 2 9 9 0 0 10 10 0 6 11 11 O 4 12 12 5 Split Cloak 13 12 1 4 4 14 14 1 1 3 Frequency tables (nominal and ordinal variables) 15 15 1 6 Plats 16 16 1 6 Statistics 17 17 1 8 1B 18 1 5 19 19 1 5 20 20 1 4 21 21 1 1 2 : 22 22 1 6 23 23 1 7 24 24 1 5
Step by Step Solution
There are 3 Steps involved in it

Get step-by-step solutions from verified subject matter experts