

Question: Determine the mean for each variable ii. Determine the variance for each variable iii. Develop a scatter plot for the data above iv. Determine the
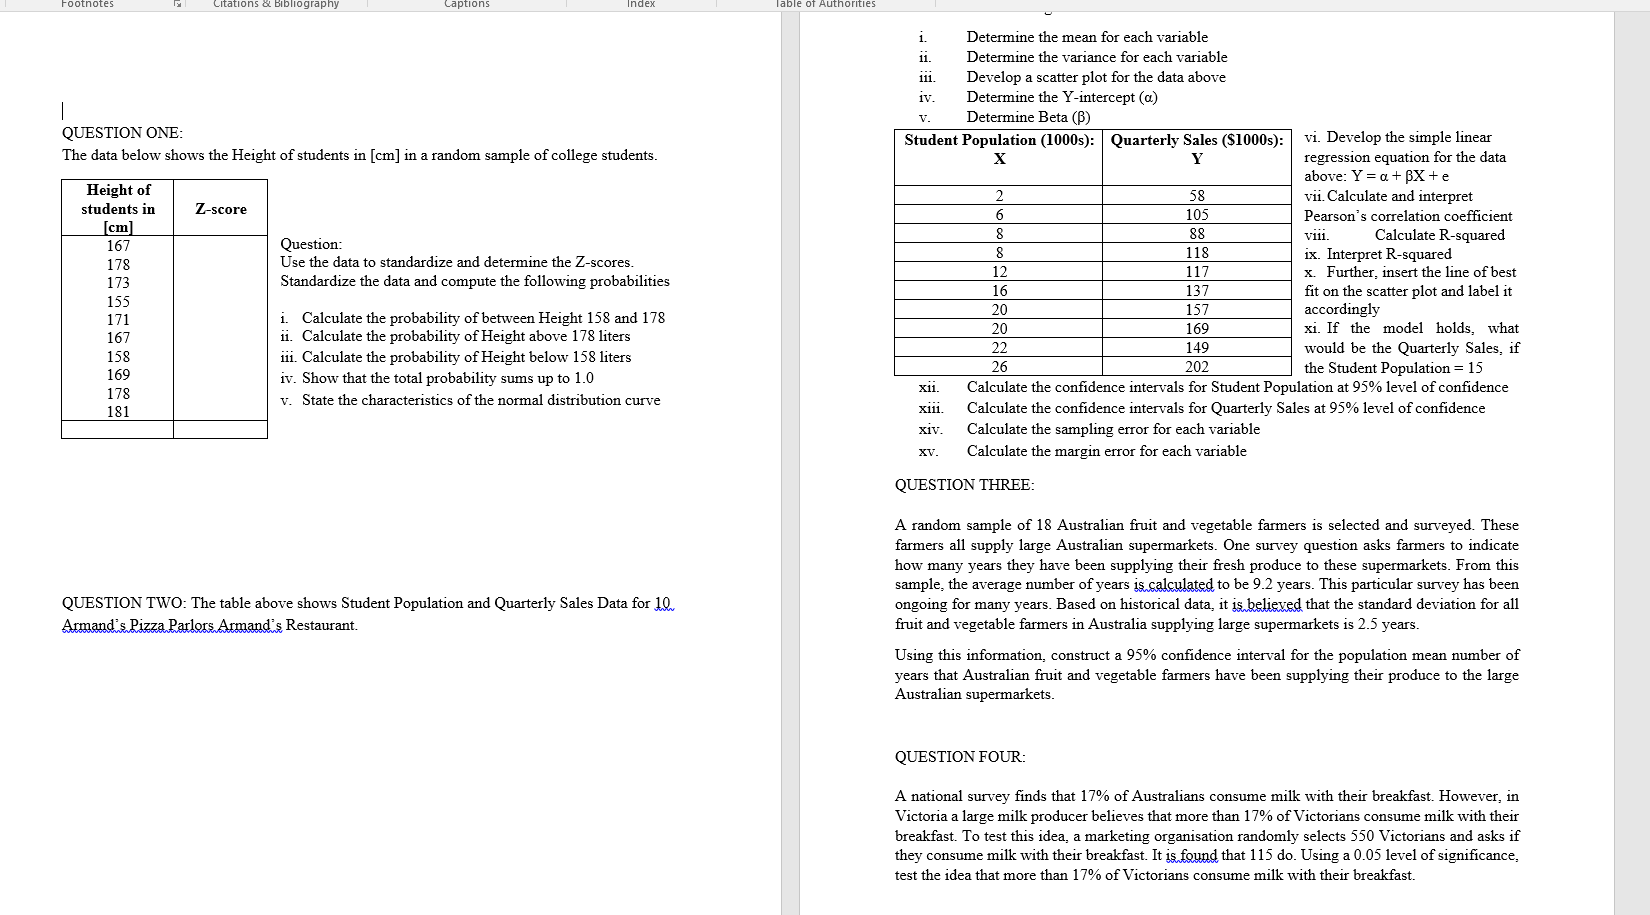
Determine the mean for each variable ii. Determine the variance for each variable iii. Develop a scatter plot for the data above iv. Determine the Y-intercept (a) Determine Beta (B) QUESTION ONE: Student Population (1000s): Quarterly Sales ($1000s): vi. Develop the simple linear The data below shows the Height of students in [cm] in a random sample of college students. X regression equation for the data above: Y = a+ BX + e Height of 2 58 students in vii. Calculate and interpret Z-score 6 105 Pearson's correlation coefficient [cm] 8 88 Question: vili. Calculate R-squared 167 8 118 178 Use the data to standardize and determine the Z-scores. ix. Interpret R-squared 12 117 173 Standardize the data and compute the following probabilities x. Further, insert the line of best 16 137 155 fit on the scatter plot and label it 171 i. Calculate the probability of between Height 158 and 178 20 157 accordingly 167 ii. Calculate the probability of Height above 178 liters 20 169 xi. If the model holds, what 158 iii. Calculate the probability of Height below 158 liters 22 149 would be the Quarterly Sales, if 169 26 202 iv. Show that the total probability sums up to 1.0 the Student Population = 15 178 X11. Calculate the confidence intervals for Student Population at 95% level of confidence 181 v. State the characteristics of the normal distribution curve xiii. Calculate the confidence intervals for Quarterly Sales at 95% level of confidence xiv. Calculate the sampling error for each variable XV. Calculate the margin error for each variable QUESTION THREE: A random sample of 18 Australian fruit and vegetable farmers is selected and surveyed. These farmers all supply large Australian supermarkets. One survey question asks farmers to indicate how many years they have been supplying their fresh produce to these supermarkets. From this sample, the average number of years is calculated to be 9.2 years. This particular survey has been QUESTION TWO: The table above shows Student Population and Quarterly Sales Data for Llu ongoing for many years. Based on historical data, it is believed that the standard deviation for all Armand's Pizza Parlors Armand's Restaurant. fruit and vegetable farmers in Australia supplying large supermarkets is 2.5 years. Using this information, construct a 95% confidence interval for the population mean number of years that Australian fruit and vegetable farmers have been supplying their produce to the large Australian supermarkets. QUESTION FOUR: A national survey finds that 17% of Australians consume milk with their breakfast. However, in Victoria a large milk producer believes that more than 17% of Victorians consume milk with their breakfast. To test this idea, a marketing organisation randomly selects 550 Victorians and asks if they consume milk with their breakfast. It is found that 115 do. Using a 0.05 level of significance, test the idea that more than 17% of Victorians consume milk with their breakfast
Step by Step Solution
There are 3 Steps involved in it

Get step-by-step solutions from verified subject matter experts