

Question: Determine the normal approximation to the relative log-likelihood function, rN(q). Sketch r(q) and rN(q) on the same plot for q ? [1, 40] and compare
Determine the normal approximation to the relative log-likelihood function, rN(q). Sketch r(q) and rN(q) on the same plot for q ? [1, 40] and compare them.
I have some working below
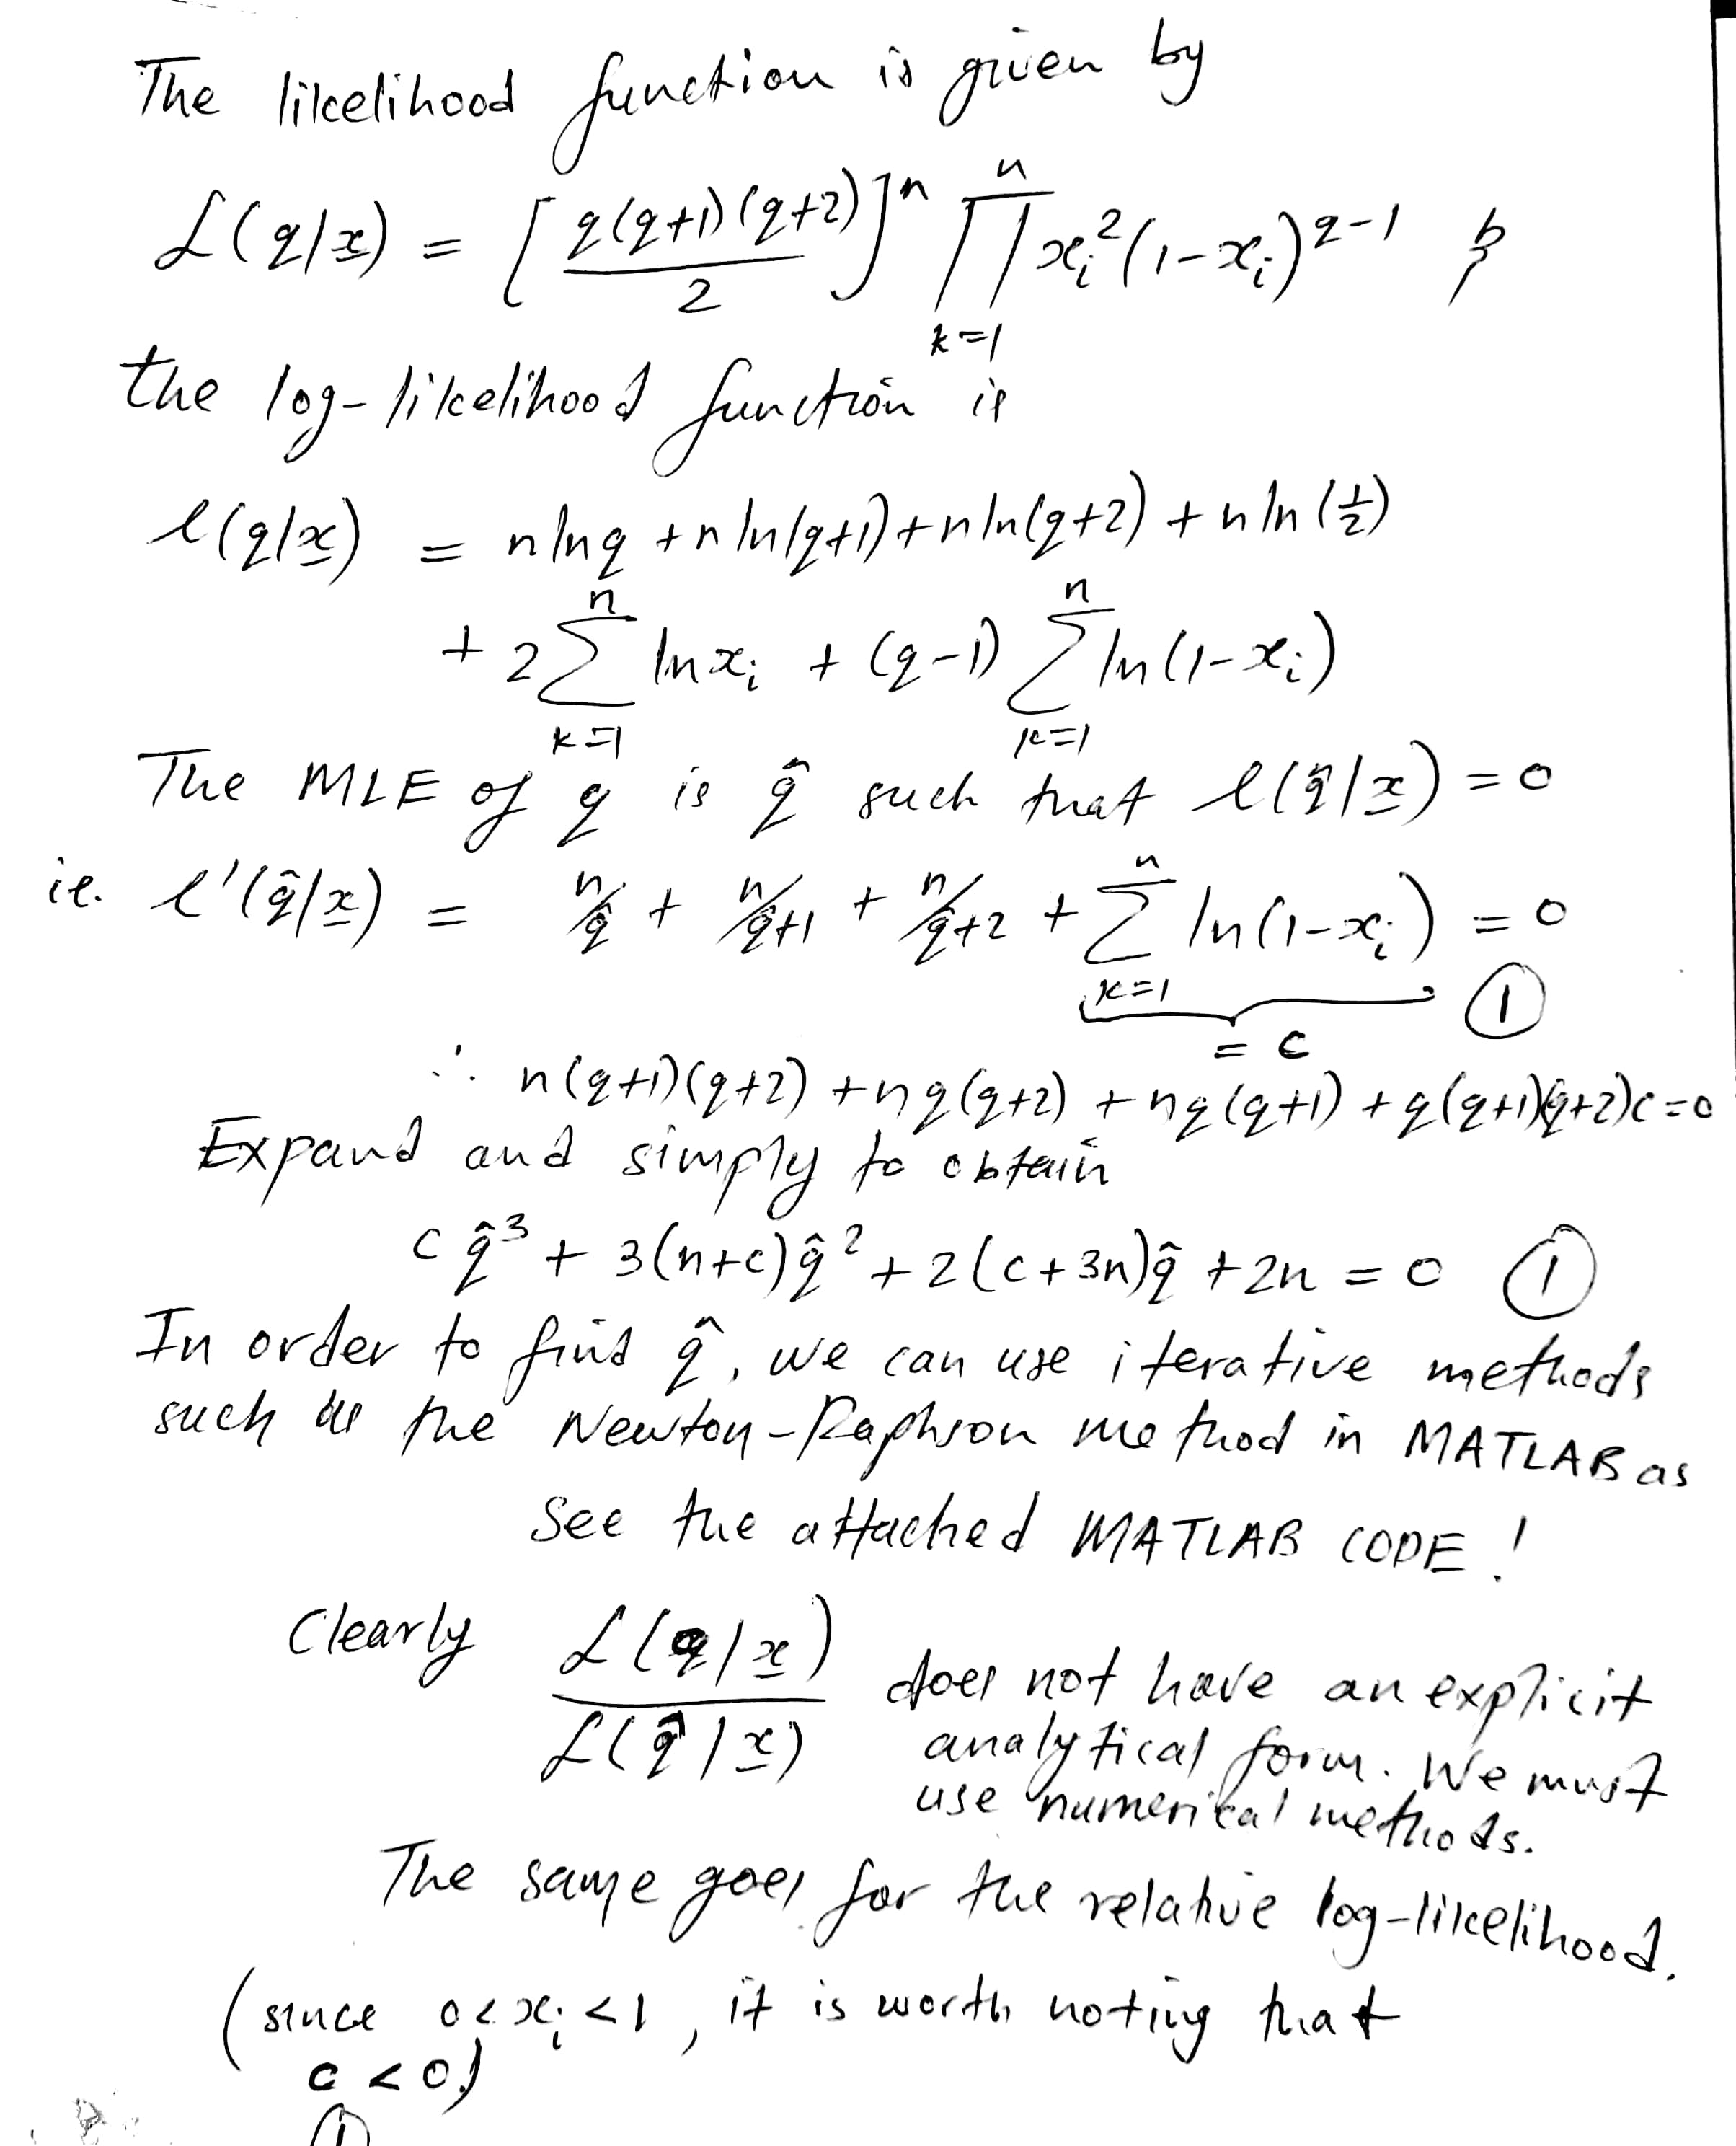
The likelihood function is given by L ( 4 / z) = [ 2 (9+ 1) 12+2) ) - IT 2(1-20.) 2-1 8 2 the log-likelihood function is * = 1 ( (glac ) = ning +rlulgti) thinly + 2 ) +hin le ) + 25 Inxi + ( 9 - 1) 7 In (1- x: ) * 51 10 = 1 The MIF of of is I such that ( 191 2 ) = 0 ie. ('19/2 ) = = 0 1 = 1 = C . ' . n ( q + 1 ) ( 9 + 2 ) + ng ( 9 + 2 ) + nq (q+1 ) + q lz+ +2)c= 0 Expand and simply to obtain cq3 + 3 ( n+ c ) 9 2 + 2 (c+ 3n)9 + 2n = 0 (1 ) In order to find & , we can use iterative methods such as the Newtoy-Raphson method in MATLAB as See the attached MATLAB COPE.! clearly L (9/ 2 ) does not have an explicit analytical form . We must use numerical methods. The same goer for the relative log-likelihood. since octe; 21 , it is worth noting that
Step by Step Solution
There are 3 Steps involved in it

Get step-by-step solutions from verified subject matter experts