Question: Determine the pp , S p , UCL and LCL for a p -chart of 95 percent confidence (1.96 standard deviations). (Leave no cells blank.

Determine the pp , Sp, UCL and LCL for a p-chart of 95 percent confidence (1.96 standard deviations). (Leave no cells blank. Round up any negative LCL value to "0". Round your answers to 3 decimal places.)Determine the pp , S p , UCL and LCL for a p

Ten samples of 15 parts each were taken from an ongoing process to establish a p-chart for control. The samples and the number of defectives in each are shown in the following table. SAMPLE 1 2 3 4 5 6 7 8 9 10 n 15 15 15 15 15 15 15 15 15 15 NUMBER OF DEFECTIVE ITEMS IN THE SAMPLE 3 3 1 2 3 3 3 a. Determine the p, Sp. UCL and LCL for a p-chart of 95 percent confidence (1.96 standard deviations). (Leave no cells blank. Round up any negative LCL value to "O". Round your answers to 3 decimal places.) P Sp UCL LCL b. What comments can you make about the process? O Process is out of statistical control O Process is in statistical control

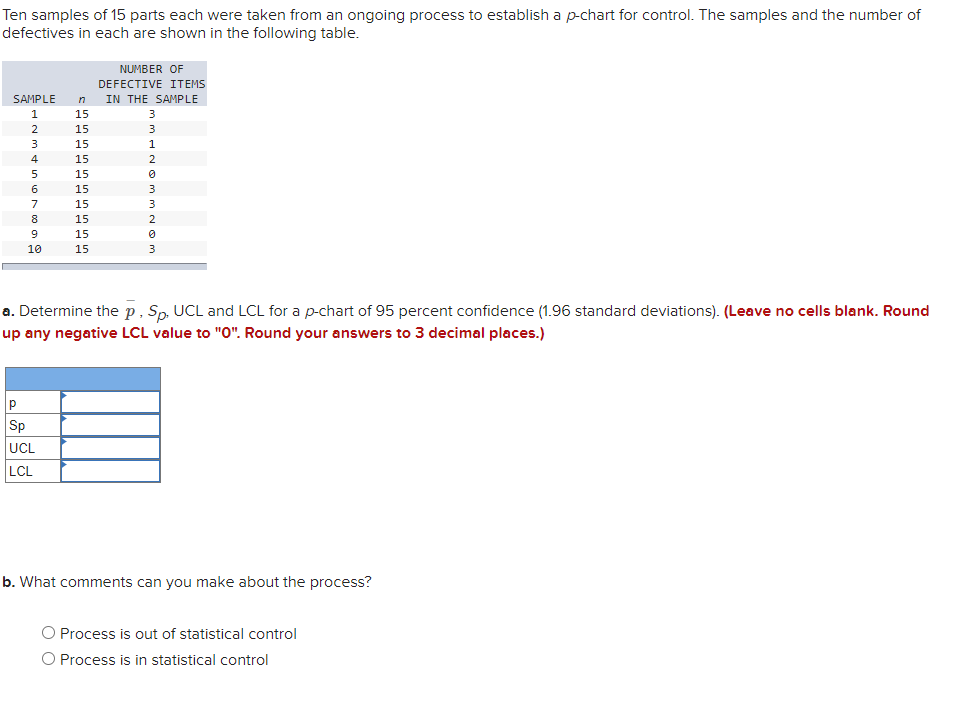
Step by Step Solution

There are 3 Steps involved in it

1 Expert Approved Answer
Step: 1 Unlock blur-text-image
Question Has Been Solved by an Expert!

Get step-by-step solutions from verified subject matter experts

Step: 2 Unlock
Step: 3 Unlock

Students Have Also Explored These Related General Management Questions!