

Question: Determine the pp , S p , UCL and LCL for a p -chart of 95 percent confidence (1.96 standard deviations). Ten samples of 15
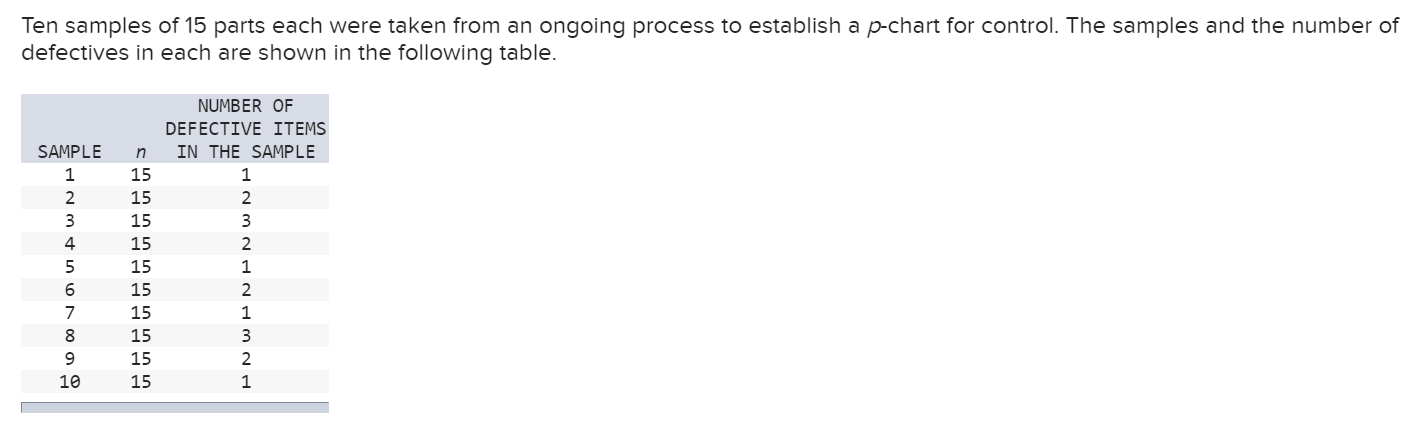 Determine the pp , Sp, UCL and LCL for a p-chart of 95 percent confidence (1.96 standard deviations).
Step by Step Solution
There are 3 Steps involved in it
1 Expert Approved Answer
Step: 1 Unlock

Question Has Been Solved by an Expert!
Get step-by-step solutions from verified subject matter experts
Step: 2 Unlock
Step: 3 Unlock