

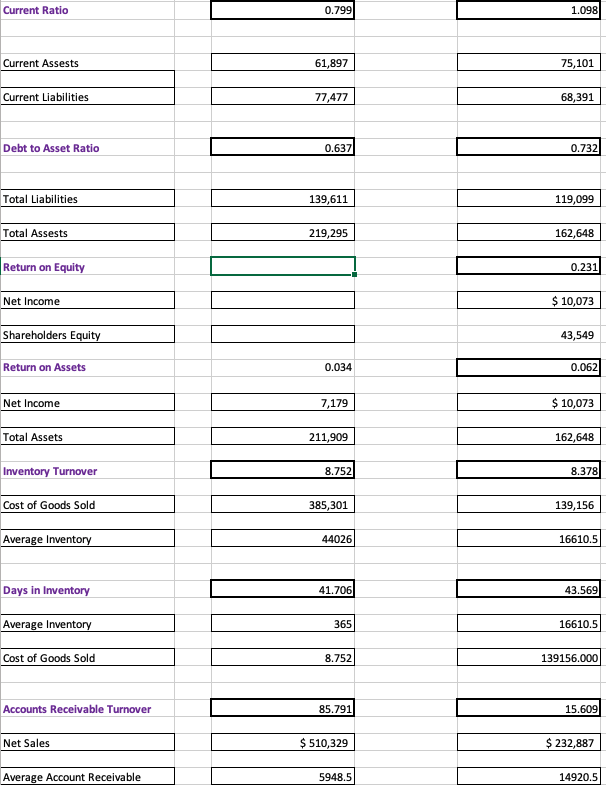
Question: Determine what amounts are needed to calculate the ratios requested. For example you need Current Assets and Current Liabilities to compute the Current Ratio. Enter
Determine what amounts are needed to calculate the ratios requested. For example you need Current Assets and Current Liabilities to compute the Current Ratio.
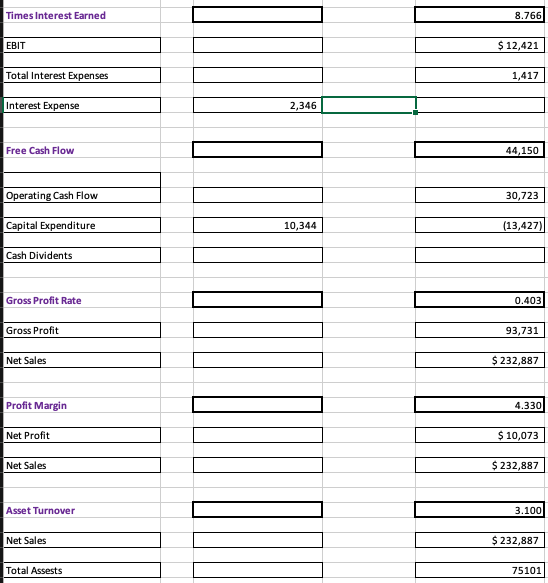
Enter the names of the items needed in the boxes in column A for each of the ratios.
See Ratios Tab, column A for Current Ratio.
Next, use the cell reference function and any other necessary formulas to enter the numbers for each of the items for each of the companies in the boxes under the requested ratios.
Again see Ratios Tab Columns C and E for the Current Ratio for Walmart and for Amazon.
ROUND ALL RATIO AMOUNTS TO 3 DECIMAL PLACES.
Next use the numbers you have entered to calculate the ratios requested. Again see the Ratios Tab Columns C and E for Current Ratio for Walmart and for Amazon.
Please complete the formulas for Walmart using the year and please provide the formulas used.
The Fiscal Year ends in 2018 so please use the 2019 numbers. Please complete the boxes that are not filled in.
Thank you.
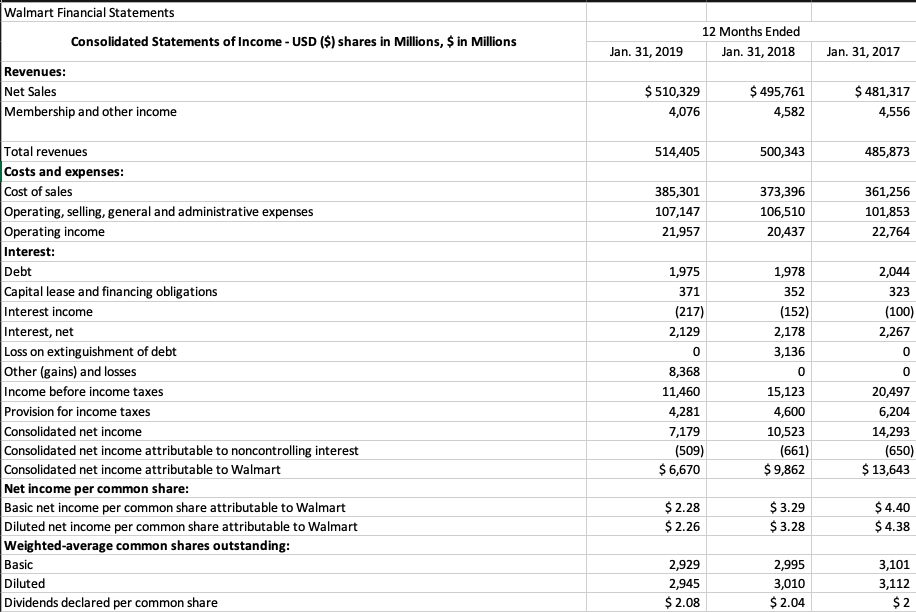
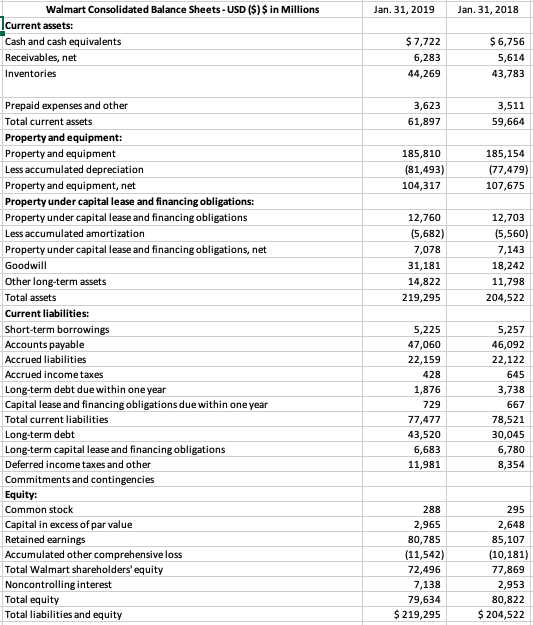
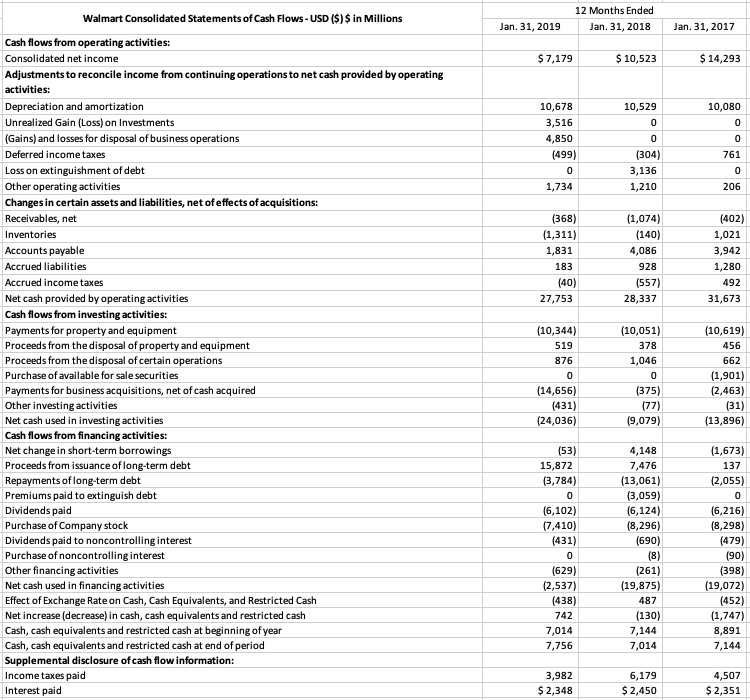
Walmart Financial Statements Consolidated Statements of Income - USD ($) shares in Millions, $ in Millions 12 Months Ended Jan. 31, 2018 Jan. 31, 2019 Jan. 31, 2017 Revenues: Net Sales Membership and other income $ 510,329 4,076 $ 495,761 4,582 $ 481,317 4,556 514,405 500,343 485,873 385,301 107,147 21,957 373,396 106,510 20,437 361,256 101,853 22,764 1,975 371 (217) 2,129 1,978 352 (152) 2,178 3,136 2,044 323 (100) 2,267 0 Total revenues Costs and expenses: Cost of sales Operating, selling, general and administrative expenses Operating income Interest: Debt Capital lease and financing obligations Interest income Interest, net Loss on extinguishment of debt Other (gains) and losses Income before income taxes Provision for income taxes Consolidated net income Consolidated net income attributable to noncontrolling interest Consolidated net income attributable to Walmart Net income per common share: Basic net income per common share attributable to Walmart Diluted net income per common share attributable to Walmart Weighted average common shares outstanding: Basic Diluted Dividends declared per common share 0 8,368 11,460 4,281 7,179 (509) $6,670 15,123 4,600 10,523 (661) $ 9,862 20,497 6,204 14,293 (650) $ 13,643 $ 2.28 $ 2.26 $ 3.29 $ 3.28 $4.40 $ 4.38 2,929 2,945 $ 2.08 2,995 3,010 $ 2.04 3,101 3,112 $ 2 Jan. 31, 2019 Jan. 31, 2018 Walmart Consolidated Balance Sheets - USD ($) $ in Millions Current assets: Cash and cash equivalents Receivables, net Inventories $ 7,722 6,283 44,269 $ 6,756 5,614 43,783 3,623 61,897 3,511 59,664 185,810 (81,493) 104,317 185,154 (77,479) 107,675 12,760 (5,682) 7,078 31,181 14,822 219,295 12,703 (5,560) 7,143 18,242 11,798 204,522 Prepaid expenses and other Total current assets Property and equipment: Property and equipment Less accumulated depreciation Property and equipment, net Property under capital lease and financing obligations: Property under capital lease and financing obligations Less accumulated amortization Property under capital lease and financing obligations, net Goodwill Other long-term assets Total assets Current liabilities: Short-term borrowings Accounts payable Accrued liabilities Accrued income taxes Long-term debt due within one year Capital lease and financing obligations due within one year Total current liabilities Long-term debt Long-term capital lease and financing obligations Deferred income taxes and other Commitments and contingencies Equity: Common stock Capital in excess of par value Retained earnings Accumulated other comprehensive loss Total Walmart shareholders' equity Noncontrolling interest Total equity Total liabilities and equity 5,225 47,060 22,159 428 1,876 729 77,477 43,520 6,683 11,981 5,257 46,092 22,122 645 3,738 667 78,521 30,045 6,780 8,354 288 2,965 80,785 (11,542) 72,496 7,138 79,634 $ 219,295 295 2,648 85,107 (10,181) 77,869 2,953 80,822 $ 204,522 Walmart Consolidated Statements of Cash Flows - USD ($) $ in Millions 12 Months Ended Jan. 31, 2018 Jan. 31, 2019 Jan. 31, 2017 $ 7,179 $ 10,523 $14,293 10,529 10,080 10,678 3,516 4,850 (499) 761 (304) 3,136 1,210 1,734 206 (368) (1,311) 1,831 183 (40) 27,753 (1,074) (140) 4,086 928 (557) 28,337 (402) 1,021 3,942 1,280 492 31,673 Cash flows from operating activities: Consolidated net income Adjustments to reconcile income from continuing operations to net cash provided by operating activities: Depreciation and amortization Unrealized Gain (Loss) on Investments (Gains) and losses for disposal of business operations Deferred income taxes Loss on extinguishment of debt Other operating activities Changes in certain assets and liabilities, net of effects of acquisitions: Receivables, net Inventories Accounts payable Accrued liabilities Accrued income taxes Net cash provided by operating activities Cash flows from investing activities: Payments for property and equipment Proceeds from the disposal of property and equipment Proceeds from the disposal of certain operations Purchase of available for sale securities Payments for business acquisitions, net of cash acquired Other investing activities Net cash used in investing activities Cash flows from financing activities: Net change in short-term borrowings Proceeds from issuance of long-term debt Repayments of long-term debt Premiums paid to extinguish debt Dividends paid Purchase of Company stock Dividends paid to noncontrolling interest Purchase of noncontrolling interest Other financing activities Net cash used in financing activities Effect of Exchange Rate on Cash, Cash Equivalents, and Restricted Cash Net increase (decrease) in cash, cash equivalents and restricted cash Cash, cash equivalents and restricted cash at beginning of year Cash, cash equivalents and restricted cash at end of period Supplemental disclosure of cash flow information: Income taxes paid Interest paid (10,344) 519 876 (10,051) 378 1,046 (10,619) 456 662 (1,901) (2,463) (31) (13,896) (14,656) (431) (24,036) (375) (77) 19,079) (53) 15,872 (3,784) (1,673) 137 (2,055) (6,102) (7,410) (431) (6,216) (8,298) (479) 4,148 7,476 (13,061) (3,059) (6,124) (8,296) (690) (8) (261) (19,875) 487 (130) 7,144 7,014 190) (629) (2,537) (438) 742 7,014 7,756 (398) (19,072) (452) (1,747) 8,891 7,144 3,982 $ 2,348 6,179 $ 2,450 4,507 $ 2,351 Current Ratio 0.799 1.098 Current Assests 61,897 75,101 Current Liabilities 77,477 68,391 Debt to Asset Ratio 0.637 0.7321 Total Liabilities 139,611 119,099 Total Assests 219,295 162,648 Return on Equity 0.231 Net Income $ 10,073 Shareholders Equity 43,549 Return on Assets 0.034 0.062 Net Income 7,179 $ 10,073 Total Assets 211,909 162,648 Inventory Turnover 8.752 1 8 .378 Cost of Goods Sold 385,301 139,156 Average Inventory 44026 16610.5 Days in Inventory 41.706 43.569 Average Inventory 365 16610.5 Cost of Goods Sold 8.752 139156.000 Accounts Receivable Turnover 85.791 15.609 Net Sales $ 510,329 $ 232,887 Average Account Receivable 5948.5 14920.5 Times Interest Earned 8.766 EBIT $12,421 Total Interest Expenses L 1 ,417 Interest Expense 2,346 Free Cash Flow 44,150 Operating Cash Flow 30,723 Capital Expenditure 10.344 (13,427) Cash Dividents Gross Profit Rate 0.403 Gross Profit 93,731 Net Sales $ 232,887 Profit Margin 4.330 Net Profit L $ 10,073 Net Sales $ 232,887 Asset Turnover 3.100 Net Sales $ 232,887 Total Assests 75101
Step by Step Solution
There are 3 Steps involved in it

Get step-by-step solutions from verified subject matter experts