

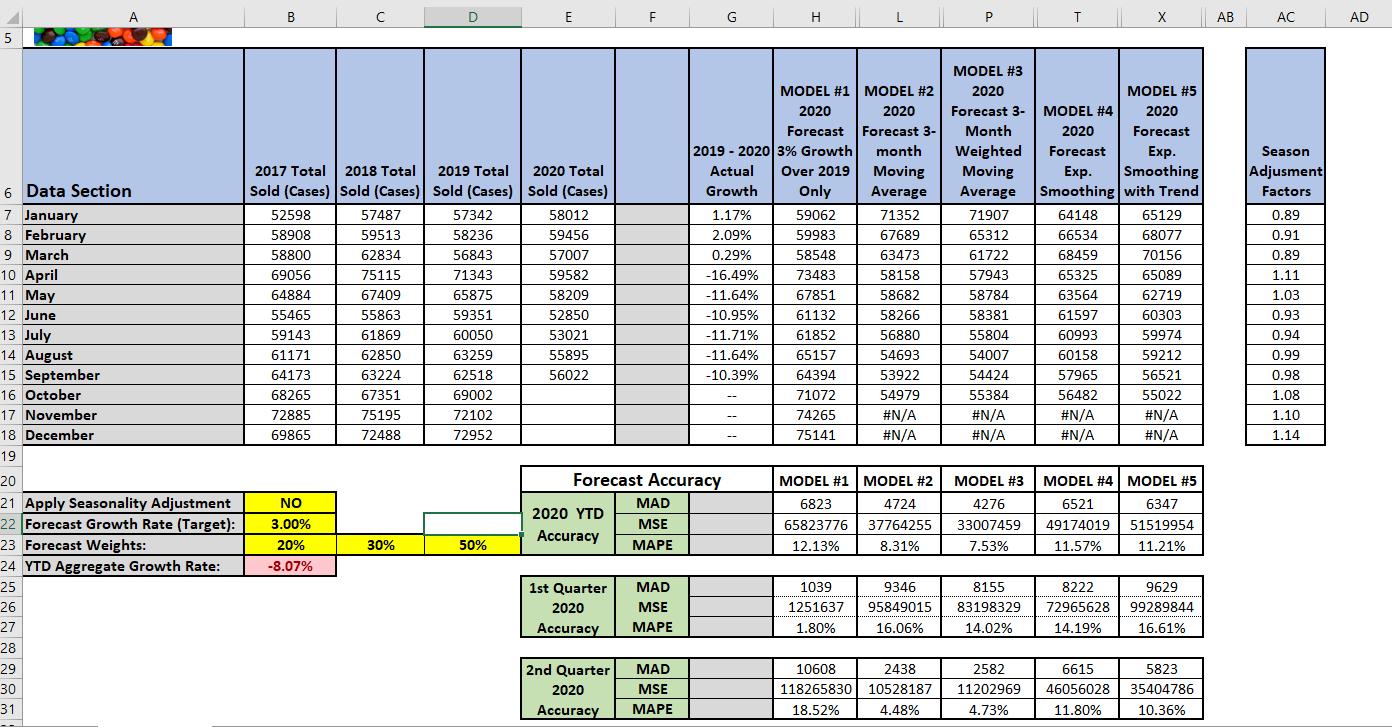
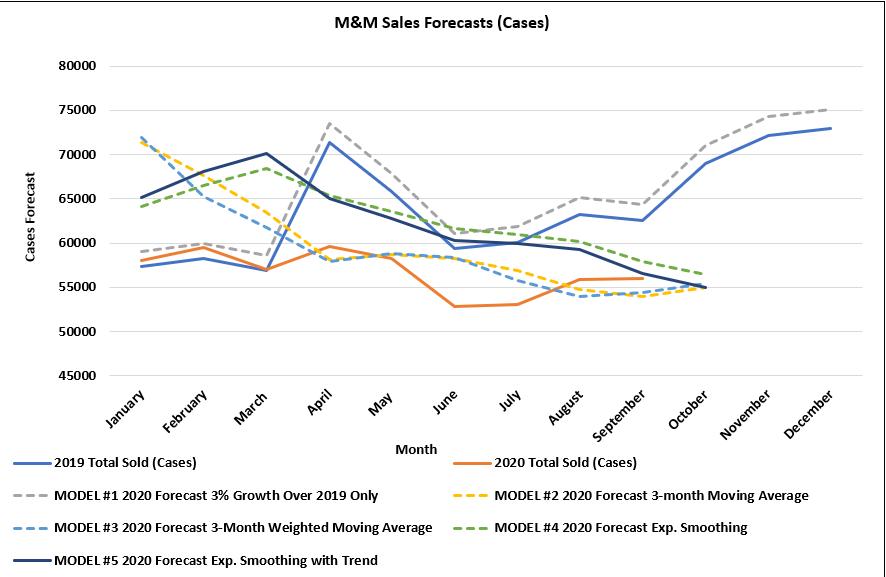
Determine whether any of the other four forecasting models would have had better results than Model #1
Fantastic news! We've Found the answer you've been seeking!
Question:
Determine whether any of the other four forecasting models would have had better results than Model #1
Expert Answer:
It is difficult to say if any of the other four forecasting models would have had better results than Model 1 Each forecasting model was based on diff... View the full answer

Related Book For 

Elementary Statistics Picturing the World
ISBN: 978-0134683416
7th edition
Authors: Ron Larson, Betsy Farber
Posted Date:
