

Question: Determine whether the graph shown could represent a variable with a normal distribution. Explain your reasoning. If the graph appears to represent a normal
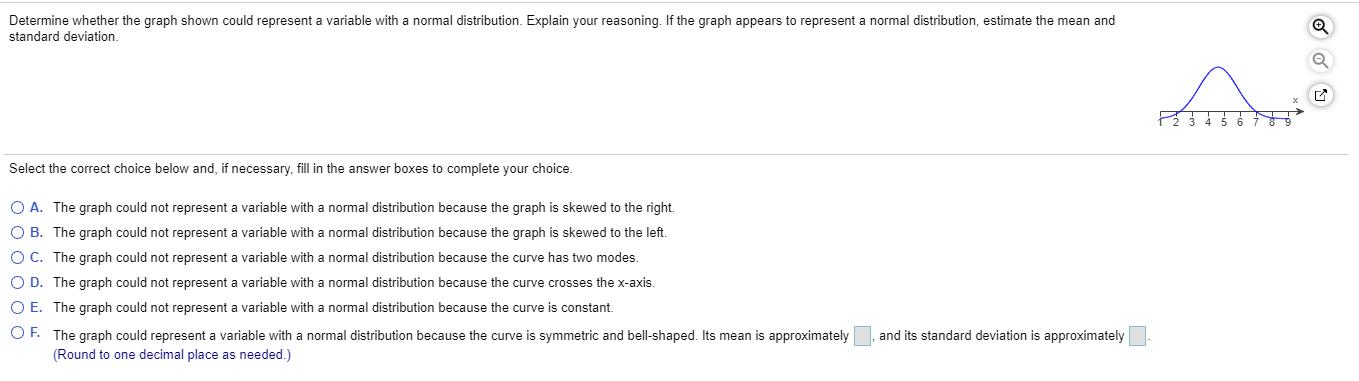
Determine whether the graph shown could represent a variable with a normal distribution. Explain your reasoning. If the graph appears to represent a normal distribution, estimate the mean and standard deviation. Select the correct choice below and, if necessary, fill in the answer boxes to complete your choice. O A. The graph could not represent a variable with a normal distribution because the graph is skewed to the right. O B. The graph could not represent a variable with a normal distribution because the graph is skewed to the left. OC. The graph could not represent a variable with a normal distribution because the curve has two modes. O D. The graph could not represent a variable with a normal distribution because the curve crosses the x-axis. O E. The graph could not represent a variable with a normal distribution because the curve is constant. OF. The graph could represent a variable with a normal distribution because the curve is symmetric and bell-shaped. Its mean is approximately (Round to one decimal place as needed.) and its standard deviation is approximately.
Step by Step Solution
There are 3 Steps involved in it
To determine whether the graph could represent a normal distribution lets analyze its characteristic... View full answer

Get step-by-step solutions from verified subject matter experts