

Question: Determine whether the table represents a discrete probability distribution. Explain why or why not. P(x) 57 0.1 67 0.8 77 -0.3 87 0.1 Send
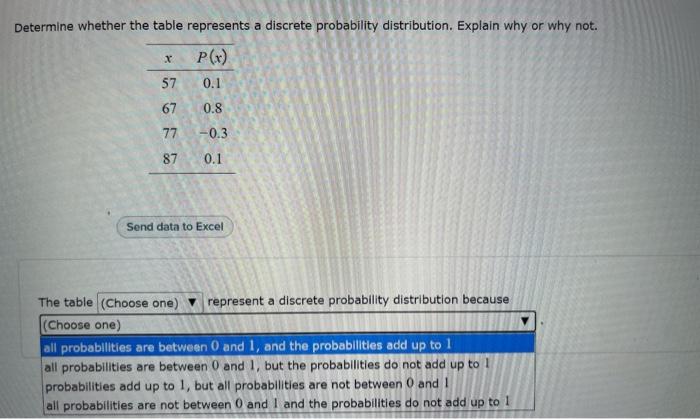
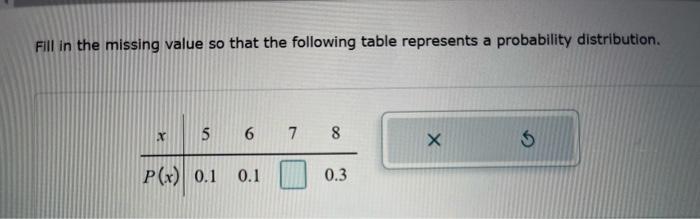
Determine whether the table represents a discrete probability distribution. Explain why or why not. P(x) 57 0.1 67 0.8 77 -0.3 87 0.1 Send data to Excel The table (Choose one) represent a discrete probability distribution because (Choose one) all probablities are between 0 and 1, and the probabilities add up to 1 all probabilities are between 0 and 1, but the probabilities do not add up to 1 probabilities add up to 1, but all probabilities are not between 0 and I all probabilities are not between 0 and I and the probabilities do not add up to 1 Fill in the missing value so that the following table represents a probability distribution. 6 7 8 P(x) 0.1 0.1 0.3
Step by Step Solution
3.34 Rating (148 Votes )
There are 3 Steps involved in it
Given thal 57 67 77 o8 03 87 By using he definian q frobabi... View full answer

Get step-by-step solutions from verified subject matter experts