

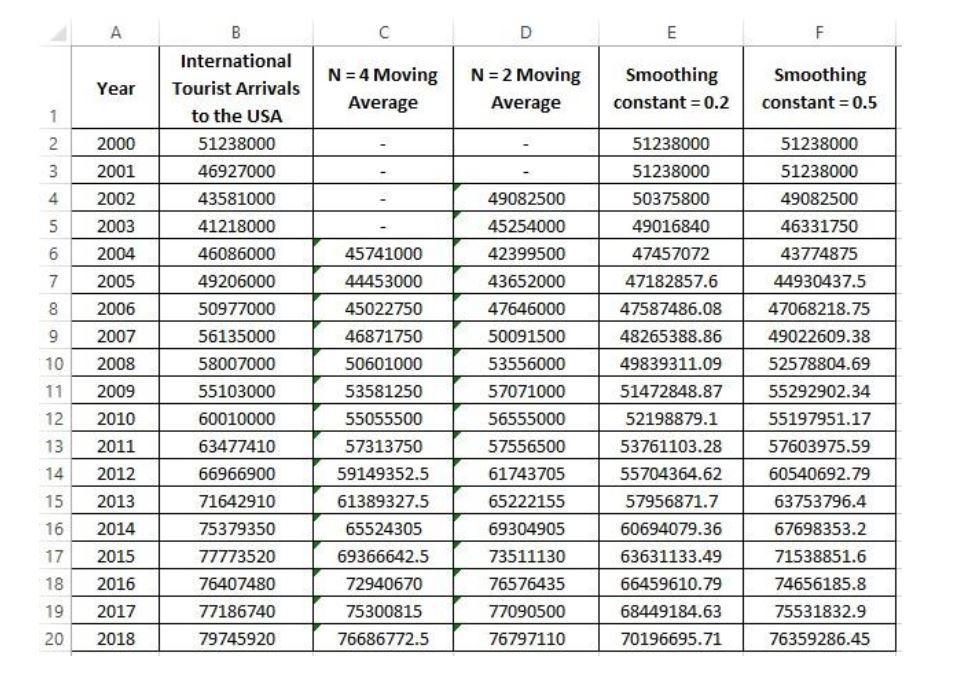
Question: Determine which forecasting models produce the best results based on MAD and MPE A B E F Year N = 4 Moving Average N =
Determine which forecasting models produce the best results based on MAD and MPE
A B E F Year N = 4 Moving Average N = 2 Moving Average Smoothing constant = 0.2 Smoothing constant = 0.5 1 International Tourist Arrivals to the USA 51238000 46927000 43581000 2 2000 2001 min 51238000 51238000 50375800 49016840 2002 41218000 2003 2004 6 46086000 47457072 45741000 44453000 7 49082500 45254000 42399500 43652000 47646000 50091500 53556000 57071000 2005 2006 2007 8 47182857.6 47587486.08 48265388.86 49839311.09 9 10 2008 11 51238000 51238000 49082500 46331750 43774875 44930437.5 47068218.75 49022609.38 52578804.69 55292902.34 55197951.17 57603975.59 60540692.79 63753796.4 67698353.2 71538851.6 74656185.8 2009 12 2010 13 49206000 50977000 56135000 58007000 55103000 60010000 63477410 66966900 71642910 75379350 77773520 76407480 77186740 79745920 2011 45022750 46871750 50601000 53581250 55055500 57313750 59149352.5 61389327.5 65524305 69366642.5 72940670 75300815 14 2012 56555000 57556500 61743705 65222155 69304905 51472848.87 52198879.1 53761103.28 55704364.62 57956871.7 60694079.36 63631133.49 66459610.79 15 2013 2014 16 17 2015 18 2016 73511130 76576435 77090500 76797110 2017 75531832.9 19 20 68449184.63 70196695.71 2018 76686772.5 76359286.45Step by Step Solution
There are 3 Steps involved in it
1 Expert Approved Answer
Step: 1 Unlock

Question Has Been Solved by an Expert!
Get step-by-step solutions from verified subject matter experts
Step: 2 Unlock
Step: 3 Unlock