

Question: Determining Fixed vs. Variable Cost Components Using Tableau (Diagnostic Analytics) Genessee Industries introduced a new product last year (6582-D). Although it was very popular, it
Determining Fixed vs. Variable Cost Components Using Tableau (Diagnostic Analytics)
Genessee Industries introduced a new product last year (6582-D). Although it was very popular, it wasnt very profitable. Management has asked you to provide them with information to help them set a new sales price.
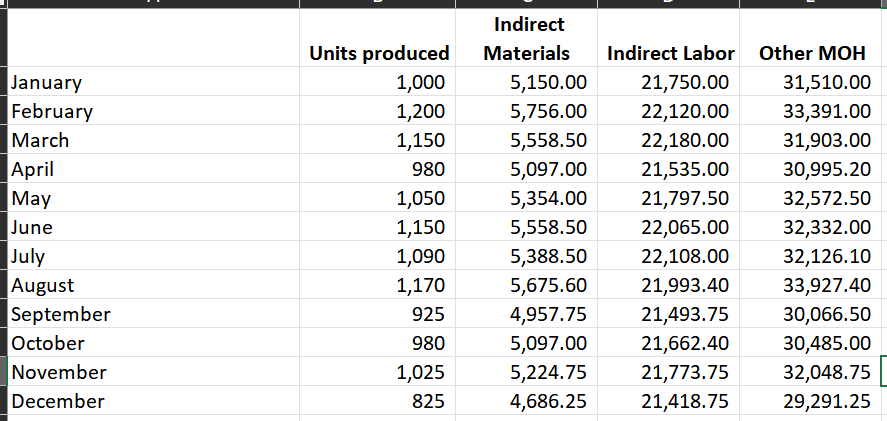
You know that the direct costs per unit are $25 for direct materials and $5 for direct labor. You are given information about last years monthly production levels and manufacturing overhead costs (indirect materials, indirect labor, and other).
Note: Round all amounts to two decimals.
1. Use the Trendline tool in Tableau to determine the fixed and variable components for each of the three manufacturing overhead components. Use the default model type (linear).
a. What is the cost formula for indirect materials? Y = $Answer(X) + $Answer
b. What is the cost formula for indirect labor? Y = $Answer(X) + $Answer
c. What is the cost formula for other manufacturing overhead? Y = $Answer(X) + $Answer
2. What is the cost formula for 6582-D (per month)? Note: Use the answers above to arrive at the correct cost formula for 6582-D.
Y = $Answer(X) + $Answer
3. Determine the minimum sales price Genessee could charge to achieve a monthly gross profit of $7,500 next year. Management expects unit sales will average 1,500 per month. Hint: You wont be able to use Tableau for this. Start by determining the CVP formula. $Answer
\begin{tabular}{|l|r|r|r|r|} & Units produced & \begin{tabular}{c} Indirect \\ Materials \end{tabular} & Indirect Labor & Other MOH \\ \hline January & 1,000 & 5,150.00 & 21,750.00 & 31,510.00 \\ \hline February & 1,200 & 5,756.00 & 22,120.00 & 33,391.00 \\ \hline March & 1,150 & 5,558.50 & 22,180.00 & 31,903.00 \\ \hline April & 980 & 5,097.00 & 21,535.00 & 30,995.20 \\ \hline May & 1,050 & 5,354.00 & 21,797.50 & 32,572.50 \\ \hline June & 1,150 & 5,558.50 & 22,065.00 & 32,332.00 \\ \hline July & 1,090 & 5,388.50 & 22,108.00 & 32,126.10 \\ \hline August & 1,170 & 5,675.60 & 21,993.40 & 33,927.40 \\ \hline September & 925 & 4,957.75 & 21,493.75 & 30,066.50 \\ \hline October & 980 & 5,097.00 & 21,662.40 & 30,485.00 \\ \hline November & 1,025 & 5,224.75 & 21,773.75 & 32,048.75 \\ \hline December & 825 & 4,686.25 & 21,418.75 & 29,291.25 \\ \hline \end{tabular}
Step by Step Solution
There are 3 Steps involved in it

Get step-by-step solutions from verified subject matter experts