

Question: Develop a frequency distribution for the variable Yearly Salary. Start with your Bin with 40,000 and increment it by 15,000 up to 130,000 - Show
Develop a frequency distribution for the variable "Yearly Salary." Start with your Bin with 40,000 and increment it by 15,000 up to 130,000 - Show a bar Chart of your frequency distribution. Comment on the shape of the distribution. - Develop a pivot table of Gender (in column) by Department (in row). Comment on your findings. -Develop a pivot table Department by Yearly Salary. Comment on your Findings. Start the grouping at 30,000 and increment it by 25,000. Comment on your findings. - Determine a 95% confidence interval for the yearly salary. What is the value of the Margin of error (Sampling error)? - Determine a 95% confidence interval for the proportion of Females in the proportion? What is the value of the sampling error (in percentage ).
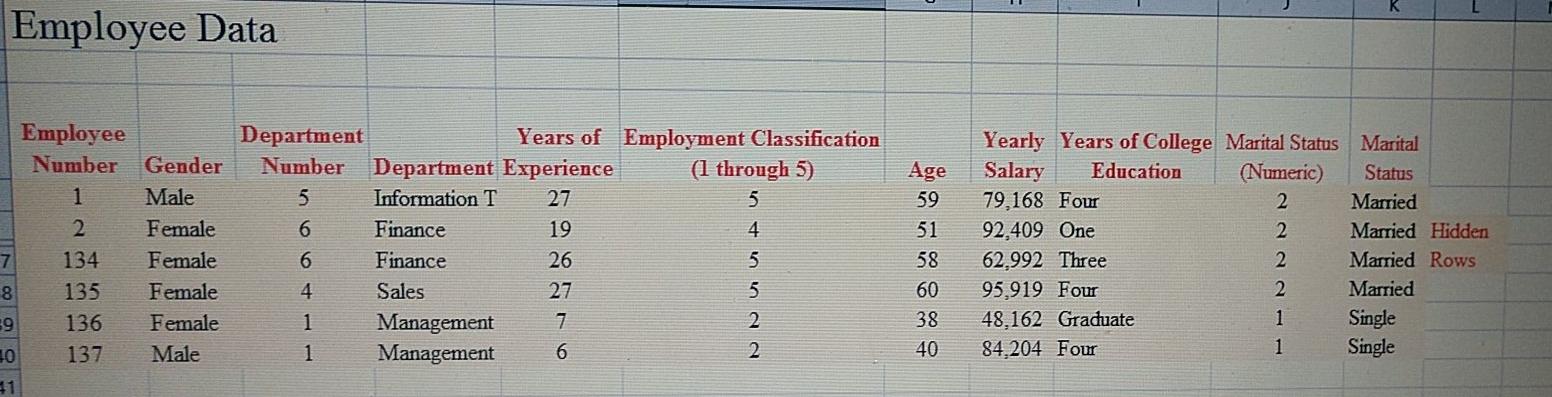
Employee Data Employee Department Years of Employment Classification Number Gender Number Department Experience (1 through 5) 1 Male 5 Information T 27 5 2 Female 6 Finance 19 4 7 134 Female 6 Finance 26 5 8 135 Female 4 Sales 27 5 59 136 Female 1 Management 7 2 137 Male 1 Management 6 2 1 Age 59 51 58 60 38 Yearly Years of College Marital Status Marital Salary Education (Numeric) Status 79,168 Four 2 Married 92,409 One 2 Married Hidden 62,992 Three 2 Married Rows 95,919 Four 2 Married 48,162 Graduate 1 Single 84,204 Four 1 Single 40
Step by Step Solution
There are 3 Steps involved in it

Get step-by-step solutions from verified subject matter experts