

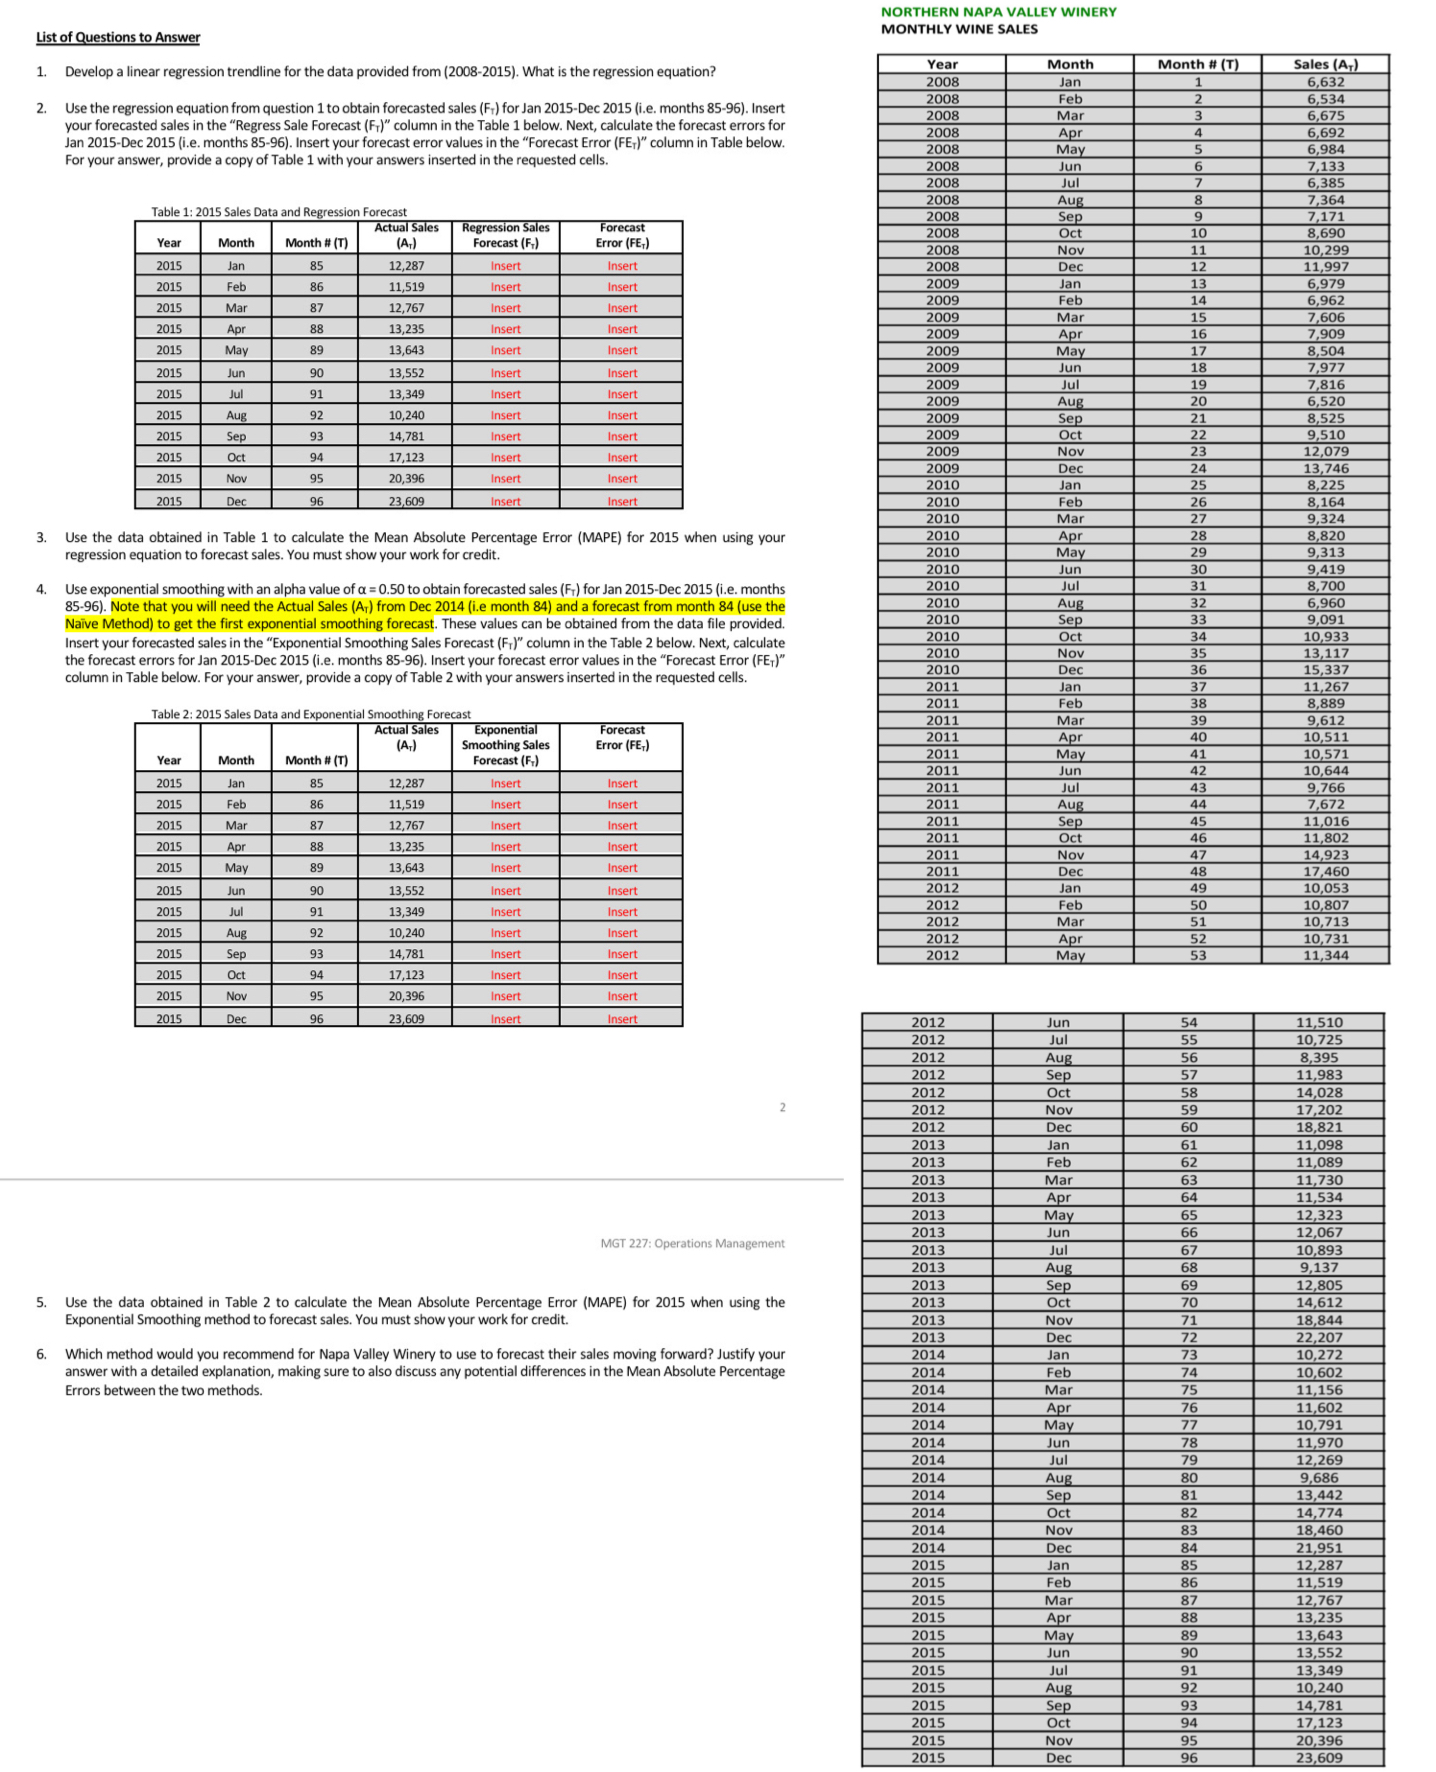
Question: Develop a linear regression trendline for the data provided from ( 2 0 0 8 - 2 0 1 5 ) . What is the
Develop a linear regression trendline for the data provided from What is the regression equation?
Use the regression equation from question to obtain forecasted sales FT for Jan Dec ie months Insert your forecasted sales in the Regress Sale Forecast FT column in the Table below. Next, calculate the forecast errors for Jan Dec ie months Insert your forecast error values in the Forecast Error FET column in Table below. For your answer, provide a copy of Table with your answers inserted in the requested cells. Use the data obtained in Table to calculate the Mean Absolute Percentage Error MAPE for when using your regression equation to forecast sales. You must show your work for credit.
Use exponential smoothing with an alpha value of alpha to obtain forecasted sales FT for Jan Dec ie months Note that you will need the Actual Sales AT from Dec ie month and a forecast from month use the Nave Method to get the first exponential smoothing forecast. These values can be obtained from the data file provided. Insert your forecasted sales in the Exponential Smoothing Sales Forecast FT column in the Table below. Next, calculate the forecast errors for Jan Dec ie months Insert your forecast error values in the Forecast Error FET column in Table below. For your answer, provide a copy of Table with your answers inserted in the requested cells. Use the data obtained in Table to calculate the Mean Absolute Percentage Error MAPE for when using the Exponential Smoothing method to forecast sales. You must show your work for credit.
Which method would you recommend for Napa Valley Winery to use to forecast their sales moving forward? Justify your answer with a detailed explanation, making sure to also discuss any potential differences in the Mean Absolute Percentage Errors between the two
methods.
Please show ALL work for each prooblem step by step complete with the tables above filled. Thank You.
Step by Step Solution
There are 3 Steps involved in it
1 Expert Approved Answer
Step: 1 Unlock

Question Has Been Solved by an Expert!
Get step-by-step solutions from verified subject matter experts
Step: 2 Unlock
Step: 3 Unlock