

Question: Develop a Pareto chart for the following data and explain the result by considering the Pareto rule. If you have technical difficulties on pasting your
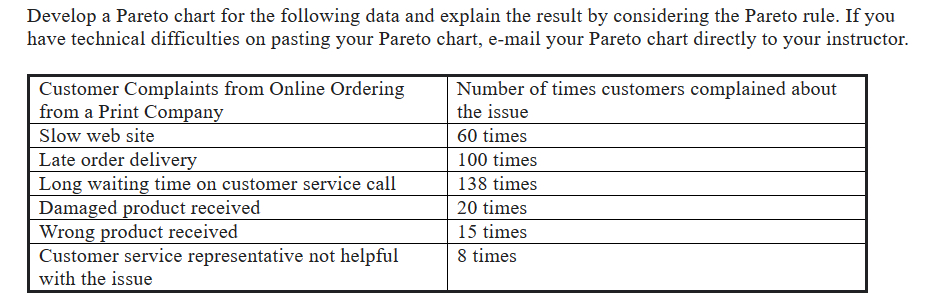
Develop a Pareto chart for the following data and explain the result by considering the Pareto rule. If you have technical difficulties on pasting your Pareto chart, email your Pareto chart directly to your instructor.
tabletableCustomer Complaints from Online Orderingfrom a Print CompanytableNumber of times customers complained aboutthe issueSlow web site, timesLate order delivery, timesLong waiting time on customer service call, timesDamaged product received, timesWrong product received, timestableCustomer service representative not helpfulwith the issue times
Step by Step Solution
There are 3 Steps involved in it
1 Expert Approved Answer
Step: 1 Unlock

Question Has Been Solved by an Expert!
Get step-by-step solutions from verified subject matter experts
Step: 2 Unlock
Step: 3 Unlock