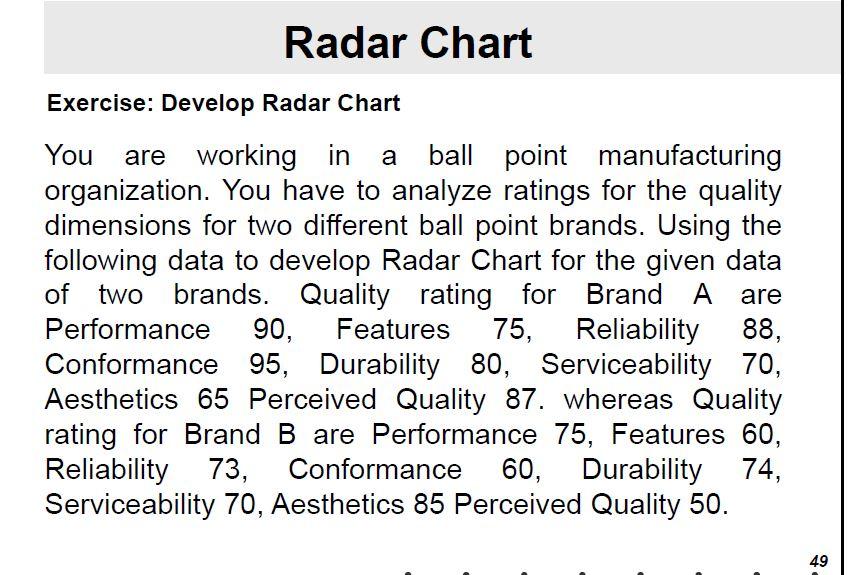
Question: DEVELOP A RADAR CHART .ANWER SHOULD BE NEAT CLEANED AND WELL EXPLAINED IN EXCEL IN COMPLETE STEPS? Radar Chart Exercise: Develop Radar Chart You are

DEVELOP A RADAR CHART .ANWER SHOULD BE NEAT CLEANED AND WELL EXPLAINED IN EXCEL IN COMPLETE STEPS?

DEVELOP A RADAR CHART .ANWER SHOULD BE NEAT

Radar Chart Exercise: Develop Radar Chart You are working in a ball point manufacturing organization. You have to analyze ratings for the quality dimensions for two different ball point brands. Using the following data to develop Radar Chart for the given data of two brands. Quality rating for Brand A are Performance 90, Features 75, Reliability 88, Conformance 95, Durability 80, Serviceability 70, Aesthetics 65 Perceived Quality 87. whereas Quality rating for Brand B are Performance 75, Features 60, Reliability 73, 73, Conformance 60, Durability 74, Serviceability 70, Aesthetics 85 Perceived Quality 50. 49

Step by Step Solution

There are 3 Steps involved in it

1 Expert Approved Answer
Step: 1 Unlock blur-text-image
Question Has Been Solved by an Expert!

Get step-by-step solutions from verified subject matter experts

Step: 2 Unlock
Step: 3 Unlock

Students Have Also Explored These Related General Management Questions!