

Question: Develop a recommendation and submit a summary of your groups analysis and conclusions/recommendation: Perform analysis on the three years of Financial Statements provided for Milavec.
Develop a recommendation and submit a summary of your group’s analysis and conclusions/recommendation: Perform analysis on the three years of Financial Statements provided for Milavec. Produce a summary of your group’s conclusion about Milavec, including the recommendation you make for your chosen point of view. (For example, if you are using the Investor POV you would recommend “yes, invest” or “no, do not invest”) Provide the analytical tools you used (at least three) that support your conclusion or recommendation. Be sure to include a description of your analysis in addition to the computational work. At least some of your analytics need to include Year 5 performance.
Each group should produce
A visually appealing summary that presents your groups conclusions and provides easy-to-understand analytics to support your conclusion.
Supplemental work to provide the supporting calculations/computations and descriptions of your analysis.
What I have from the previous part of the assignment:
“Investors considering investing $100,000, who will more purchase Preferred Stock, 6%, $100 par.”
Using a percentage analysis of sales, there is a clear trend of increasing sales over the 4 periods. [(Increase in sales – original amount)/ original amount x 100]
Increase over year 1 sales: (Year 2 - 25.0%), (Year 3 - 33.3%), (Year 4 – 50.0%), (Year 5 – 166.7%)
Increase over previous years: (Year 1 to 2 – 25.0%), (Year 2 to 3 – 6.7%), (Year 3 to 4 – 12.5%), (Year 4 to 5 – 78%)
As investors in preferred stock, whose priority is to receive dividends, this trend of increasing sales is notable, and promising.
However, it must be noted that net income decreased by 23% - and was the lowest of the 3 years. Yet the business is still profitable, so this does not mean that the business would not be a good investment.
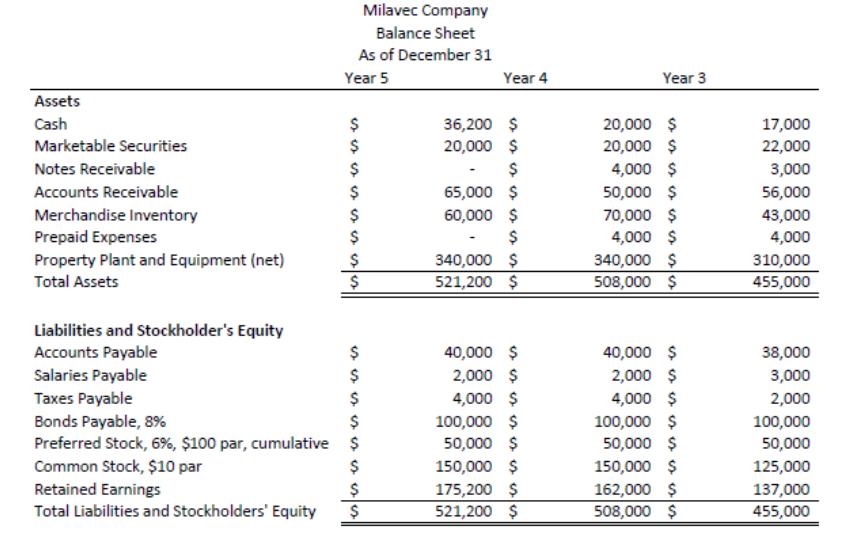
Referring to the Property Plant and Equipment horizontally, there is a 0% increase in “property” even with the increase in sales of 78% increase in sales from year 4 to year 5.
Increase from previous years (Year 3 to 4- 9.6%), (Year 4 to 5 – 0%)
Shockingly, through the increase in production left a 0% increase in fixed assets which would eventually increase production of goods.
For future investors, looking at the future becomes the main source of probability for them. With the increase in sales, investors will look forward to upcoming Property Plant and Equipment purchases to increase assets within Milavec.
Also, as stated in year 5, vertically purchases made amounted to $1,078,000 with the beginning inventory of $70,000.
Overall, the goods for sale would amount to $1,148,000 (Year 5 70,000+1078000). This shows the absence of purchases made for machinery, land, etc.
Investors want to know if a company’s financial structure is secure enough to satisfy obligations and pay debts. Debt ratios help determine whether a company is likely to go into bankruptcy, the lower the percentage the greater the security.
Total liabilities: (Year 3 – 143,000) (Year 4 – 146,000) (Year 5 – 146,000)
Total Stockholders' equity: (Year 3 – 312,000) (Year 4 - 362,000) (Year 5 – 375,000)
Debts to assets: (Year 3 – 31%) (Year 4 – 29%) (Year 5 – 28%)
Debts to equity ratio: (Year 3 – 0.46:1) (Year 4 - 0.40:1) (Year 5 – 0.39:1)
From Year 3 to Year 5, the liability percentage decreased every year, by 0.06% from Year 3 to 4 and by 0.01% from Year 4 to Year 5.
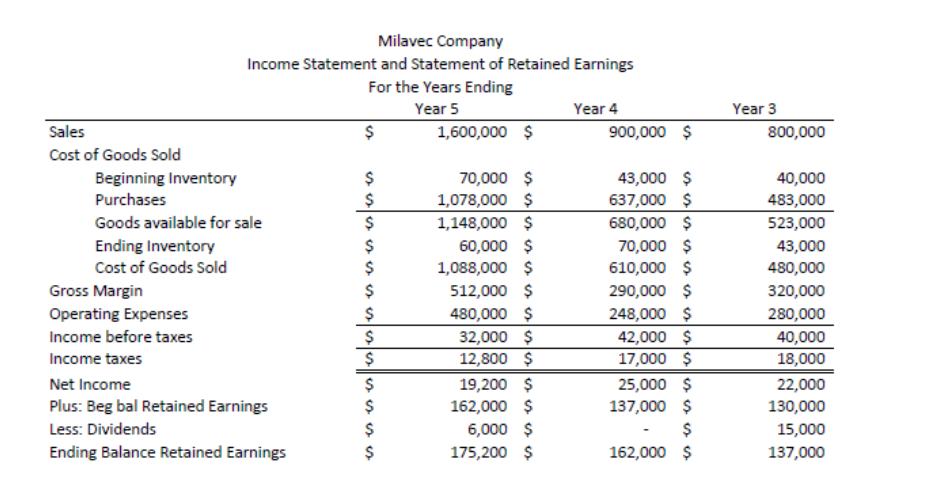
Milavec Company Income Statement and Statement of Retained Earnings For the Years Ending Year 5 Year 3 Year 4 Sales 1,600,000 $ 900,000 $ 800,000 Cost of Goods Sold 70,000 $ 1,078,000 $ Beginning Inventory 43,000 $ 40,000 Purchases 637,000 $ 483,000 1,148,000 $ 60,000 $ 1,088,000 $ Goods available for sale 680,000 $ 523,000 Ending Inventory Cost of Goods Sold 70,000 $ 610,000 $ 43,000 $ 480,000 290,000 $ 248,000 $ 42,000 $ 17,000 $ Gross Margin $ 512,000 $ 320,000 Operating Expenses 480,000 $ 280,000 40,000 18,000 Income before taxes 32,000 $ 12,800 $ Income taxes 19,200 $ 162,000 $ 25,000 $ 137,000 $ Net Income 22,000 130,000 Plus: Beg bal Retained Earnings Less: Dividends 6,000 $ 175,200 $ $ 15,000 Ending Balance Retained Earnings 162,000 $ 137,000 %24
Step by Step Solution
3.42 Rating (158 Votes )
There are 3 Steps involved in it
Develop a recommendation and submit a summary of your groups analysis and conclusionsrecommendation Perform analysis on the three years of Financial Statements provided for Milavec Produce a summary o... View full answer

Get step-by-step solutions from verified subject matter experts