

Question: Develop a simple tool for calculating some basic statistics about a segment of text. Your finished program should look as similar as possible (or better!)

Develop a simple tool for calculating some basic statistics about a segment of text. Your finished program should look as similar as possible (or better!) than the sample shown below.
The application should have a single window with a scrolling textbox (see JTextArea) and a statistics box. The statistics box should be a panel with a titled border. This box should contain labeled fields that display the following statistics:
? The number of words in the textbox
? The average word length
? The number of vowels
The statistics box should also contain a button. When the button is pressed, your application should re-compute the statistics for the current contents of the text field.
Feel free to display extra statistics than the ones currently shown.
Tips:
Remember you can nest panels.
Use layout managers.
You can wrap the text in a JTextArea using the method setLineWrap(true).
To match on non-alphanumeric characters: "\\W+"
Do not place all of your code into the constructor and the event listener. Use good OO thinking to break your
program into small pieces

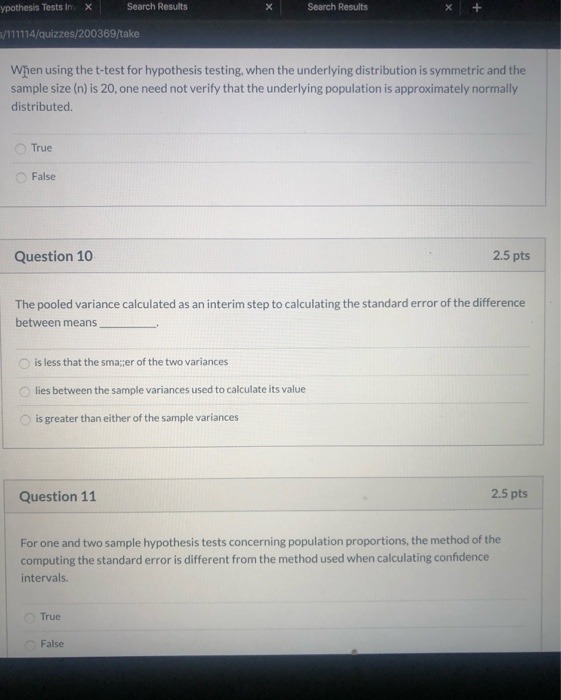
SOURCE 2. Let X = (X1, . .., Xn) be a random sample such that X; follows Rayleigh distribution with the probability density function given by f(x; 0) =$ Dze / (202) where 6 > 0 is the unknown parameter and x 2 0. (a) (5 points) Conduct the wald type and score test for hypothesis testing: Ho : 0 = 1, vs H1 : 0#1.\fpothes's Tests Im x Search Results Search Results /111114/quizzes/200369/take When using the t-test for hypothesis testing, when the underlying distribution is symmetric and the sample size (n) is 20, one need not verify that the underlying population is approximately normally distributed. True False Question 10 2.5 pts The pooled variance calculated as an interim step to calculating the standard error of the difference between means is less that the smaker of the two variances ) lies between the sample variances used to calculate its value O is greater than either of the sample variances Question 11 2.5 pts For one and two sample hypothesis tests concerning population proportions, the method of the computing the standard error is different from the method used when calculating confidence intervals. True False
Step by Step Solution
There are 3 Steps involved in it

Get step-by-step solutions from verified subject matter experts