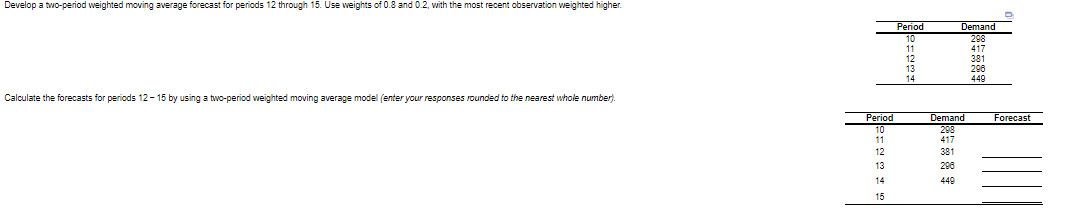
Question: Develop a two-period weighted moving average forecast for periods 12 through 15. Use weights of 0.8 and 0.2, with the most recent observation weighted higher

Develop a two-period weighted moving averageDevelop a two-period weighted moving averageDevelop a two-period weighted moving average

Develop a two-period weighted moving average forecast for periods 12 through 15. Use weights of 0.8 and 0.2, with the most recent observation weighted higher Period Demand 298 10 11 12 13 14 381 298 449 Calculate the forecasts for periods 12-15 by using a two-period weighted moving average model enter your responses rounded to the nearest whole number). Forecast Period 10 11 Demand 298 417 12 381 13 298 449 15 Develop a two-period weighted moving average forecast for March 2019 through January 2020. Use weights of 0.7 and 0.3, with the most recent observation weighted higher. Calculate the MFE, MAD, and MAPE values for March through December 2 Click the icon to view the time series data. Develop a two-period weighted moving average and fil-in the table below (enter your responses rounded to one decimal place) Month Demand Forecast January 2010 100 79 February March 107 April 90 May 98 June 136 July 100 117 August September 85 October 90 November 80 December 92 The forecast for January 2020 is Enter your response rounded to one decimal place) The MFE is (Enter your response rounded to one decimal place and include a minus sign if necessary) The MAD is (Enter your response rounded to one decimal place.) The MAPE is %. (Enter your response rounded to one decimal place.) 2: More Info Demand 100 79 Month January 2019 February March April May 107 90 98 June 138 100 117 July August September October 85 90 November 80 December 92 Develop an exponential smoothing forecast (a=0.4) for February 2019 through January 2020. Assume that your forecast for January 2019 was 60. Calculate the MFE, MAD, and MAPE values for February through December 2019. Click the icon to view the time series data. Find an exponential smoothing forecast for each period and fill-in the table below enter your responses rounded to one decimal place) Month Demand Forecast January 2010 99 60 February 74 March 95 April 84 May 109 4- 137 June 109 July August 119 September 87 October 98 November 93 December 92 The forecast for January 2020 is (Enter your response rounded to one decimal alace) The MFE is (Enter your response rounded to one decimal place and include a minus sign if necessary) The MAD is (Enter your response rounded to one decimal place) %. (Enter your response rounded to one decimal place) The MAPE is 3: More Info D Demand 99 74 95 84 Month January 2019 February March April May June July August September October 109 137 109 119 87 98 November 93 December 92

Step by Step Solution

There are 3 Steps involved in it

1 Expert Approved Answer
Step: 1 Unlock blur-text-image
Question Has Been Solved by an Expert!

Get step-by-step solutions from verified subject matter experts

Step: 2 Unlock
Step: 3 Unlock

Students Have Also Explored These Related General Management Questions!