

Question: Develop an energy baseline for a 10,000 m 2 K-12 school in Prince George, British Columbia. The electricity utility data and natural gas utility data

- Develop an energy baseline for a 10,000 m2K-12 school in Prince George, British Columbia. The electricity utility data and natural gas utility data and operating hours
- Time series graph(s) plotting the electricity monthly consumption, natural gas monthly consumption, CDD, and HDD.
- Time series graph for total energy in GJ (hint: convert electricity to GJ then add it to natural gas to calculate total energy in GJ).
- Scatter plots for electricity vs. cooling degree days and natural gas energy consumption vs heating degree days. Show the trendlines formulas and R2 values.
- Scatter plots for electricity vs. operating hours and natural gas vs. operating hours. Show the trendlines formulas and R2 values.
- Provide a brief evaluation of your conclusion on what is driving electricity and natural gas consumption at the Prince George school.
- Estimate the electricity and natural required for heating and cooling at the school.
- Briefly comment on what other end-uses are likely using energy at the school beyond heating and cooling.
- Briefly comment on the energy consumption at the school when the school is unoccupied.
- Calculate the Prince George school's Energy Use Intensity (EUI) and compare the school versus other K=12 schools as reported in Portfolio Manager Technical Reference: Canadian National Energy Use Intensity. Use the site EUI as a comparison, not the source EUI.
- Briefly comment on why the school's energy use may be higher or lower than the Canadian average
- Please attach the Excel spreadsheet you used to develop the baseline.
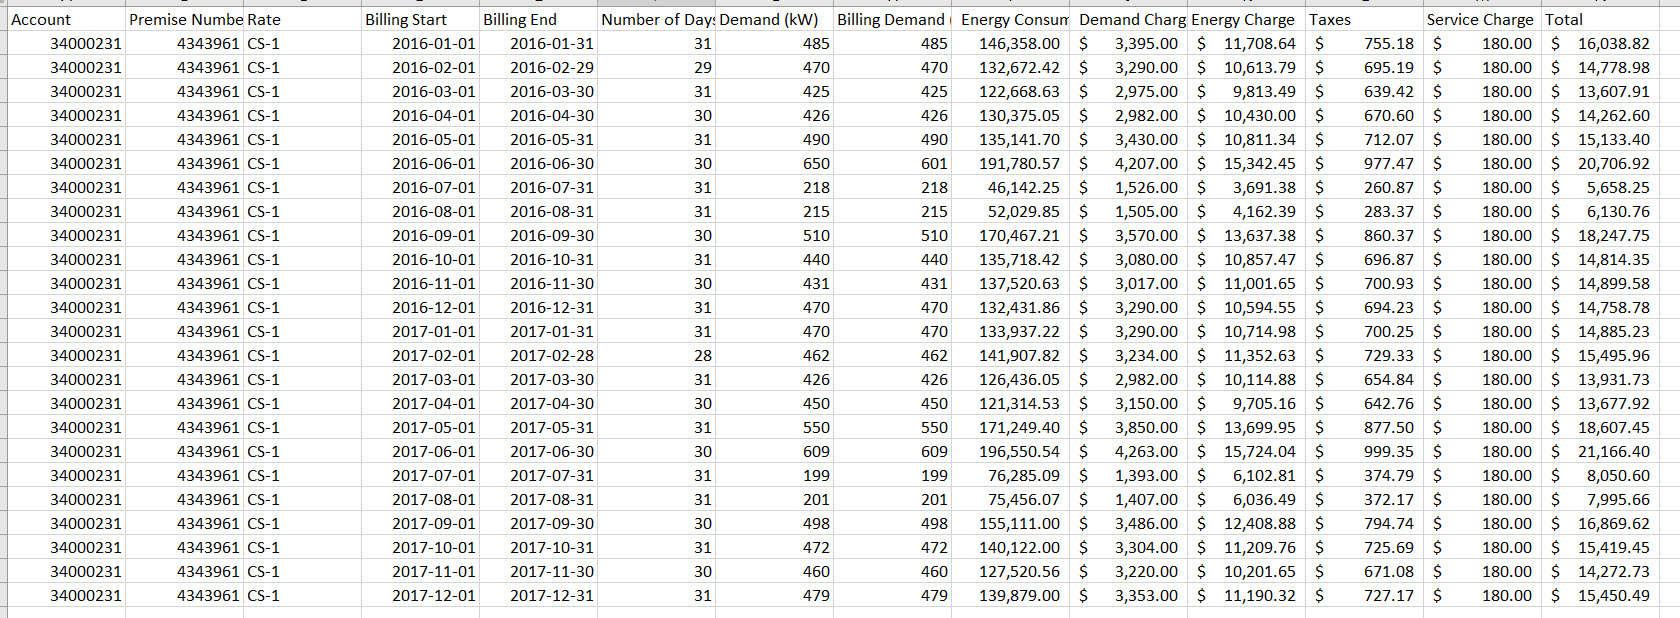


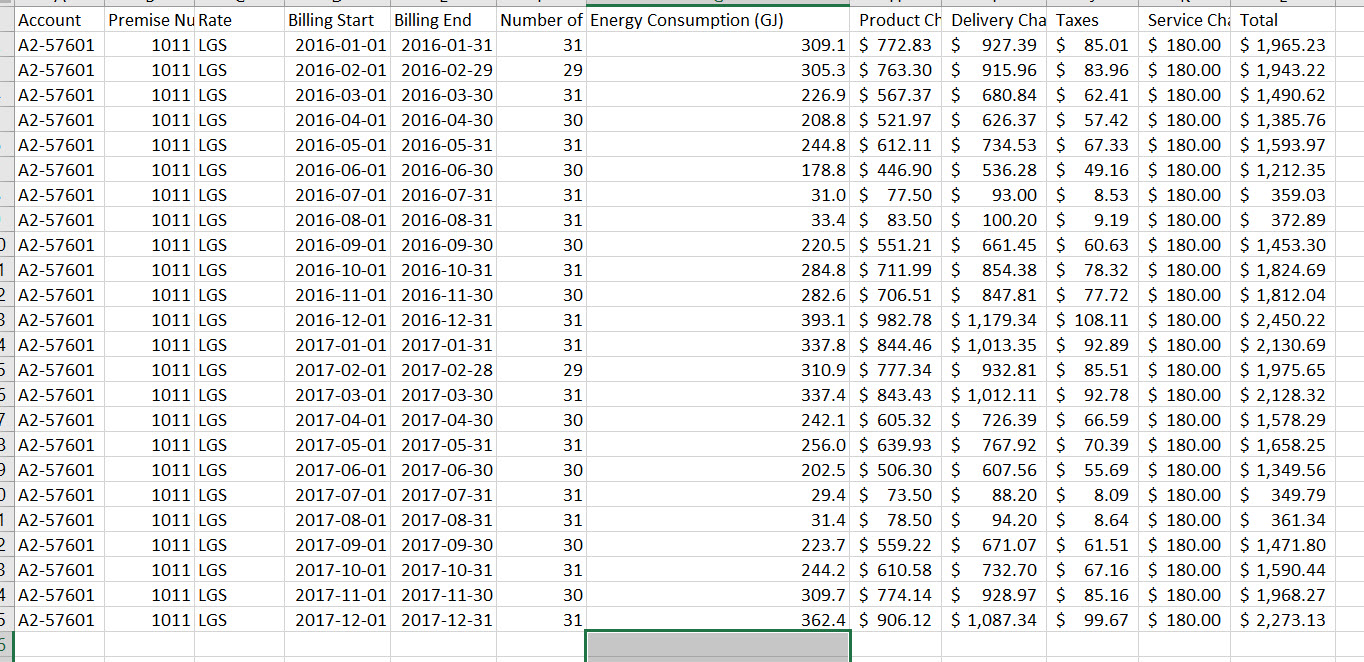
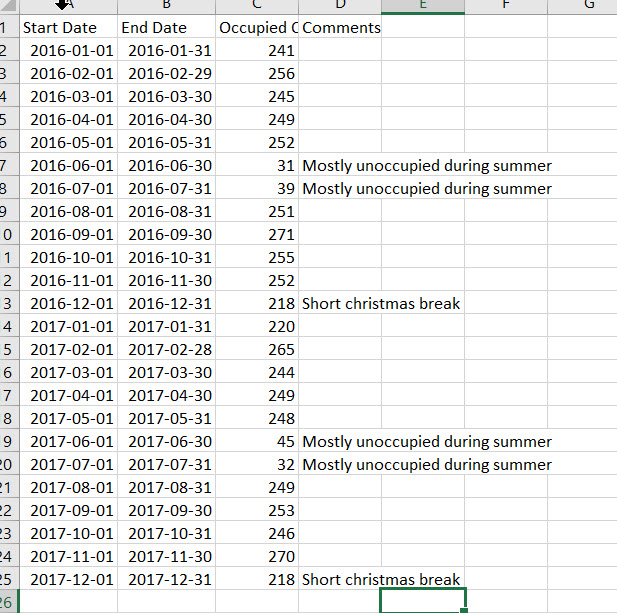
Account Premise Numbe Rate Billing Start Billing End Number of Day: Demand (kW) Billing Demand Energy Consum Demand Charg Energy Charge Taxes Service Charge Total 34000231 4343961 CS-1 2016-01-01 2016-01-31 31 485 485 146,358.00 $ 3,395.00 $ 11,708.64 $ 755.18 $ 180.00 $ 16,038.82 34000231 4343961 CS-1 2016-02-01 2016-02-29 29 470 470 132,672.42 $ 3,290.00 $ 10,613.79 S 695.19 $ 180.00 $ 14,778.98 34000231 4343961 CS-1 2016-03-01 2016-03-30 31 425 125 122,668.63 2,975.00 $ 9,813.49 S 639.42 180.00 $ 13,607.91 34000231 4343961 CS-1 2016-04-01 2016-04-30 30 426 426 130,375.05 $ 2,982.00 $ 10,430.00 $ 670.60 180.00 $ 14,262.60 34000231 4343961 CS-1 2016-05-01 2016-05-31 31 490 490 135,141.70 $ 3,430.00 $ 10,811.34 712.07 180.00 $ 15,133.40 34000231 4343961 CS-1 2016-06-01 2016-06-30 30 650 601 191,780.57 4,207.00 15,342.45 977.47 180.00 $ 20,706.92 34000231 4343961 CS-1 2016-07-01 2016-07-31 31 218 218 46,142.25 $ 1,526.00 $ 3,691.38 260.87 180.00 $ 5,658.25 34000231 4343961 CS-1 2016-08-01 2016-08-31 31 215 215 52,029.85 S 1,505.00 4,162.39 283.37 180.00 6,130.76 34000231 4343961 CS-1 2016-09-01 2016-09-30 30 510 510 170,467.21 3,570.00 13,637.38 860.37 180.00 $ 18,247.75 34000231 4343961 CS-1 2016-10-01 2016-10-31 31 140 440 135,718.42 3,080.00 10,857.47 696.87 180.00 14,814.35 34000231 4343961 CS-1 2016-11-01 2016-11-30 30 431 431 137,520.63 $ 3,017.00 $ 11,001.65 700.93 180.00 $ 14,899.58 34000231 4343961 CS-1 2016-12-01 2016-12-31 31 470 470 132,431.86 3,290.00 $ 10,594.55 694.23 180.00 $ 14,758.78 34000231 4343961 CS-1 2017-01-01 2017-01-31 31 470 470 133,937.22 un 3,290.00 10,714.98 $ 700.25 $ 180.00 $ 14,885.23 34000231 4343961 CS-1 2017-02-01 2017-02-28 28 162 162 141,907.82 3,234.00 $ 11,352.63 729.33 $ 180.00 $ 15,495.96 34000231 4343961 CS-1 2017-03-01 2017-03-30 31 426 426 126,436.05 $ 2,982.00 $ 10,114.88 654.84 $ 180.00 $ 13,931.73 34000231 4343961 CS-1 2017-04-01 2017-04-30 30 450 450 121,314.53 3,150.00 9,705.16 642.76 $ 180.00 $ 13,677.92 34000231 4343961 CS-1 2017-05-01 2017-05-31 31 50 550 171,249.40 $ 3,850.00 13,699.95 $ 877.50 $ 180.00 $ 18,607.45 34000231 4343961 CS-1 2017-06-01 2017-06-30 30 509 609 196,550.54 4,263.00 $ 15,724.04 999.35 180.00 $ 21,166.40 34000231 4343961 CS-1 2017-07-01 2017-07-31 31 199 199 76,285.09 1,393.00 6,102.81 374.79 180.00 $ 8,050.60 34000231 4343961 CS-1 2017-08-01 2017-08-31 31 201 201 75,456.07 S 1,407.00 $ 6,036.49 372.17 $ 180.00 $ 7,995.66 34000231 4343961 CS-1 2017-09-01 2017-09-30 30 198 498 155,111.00 $ 3,486.00 $ 12,408.88 S 794.74 180.00 $ 16,869.62 34000231 4343961 CS-1 2017-10-01 2017-10-31 31 472 472 140,122.00 S 3,304.00 $ 11,209.76 $ 725.69 $ 180.00 $ 15,419.45 34000231 4343961 CS-1 2017-11-01 2017-11-30 30 460 460 127,520.56 S 3,220.00 $ 10,201.65 671.08 180.00 $ 14,272.73 34000231 4343961 CS-1 2017-12-01 2017-12-31 31 179 479 139,879.00 S 3,353.00 11,190.32 727.17 180.00 $ 15,450.49Account Premise Nu Rate Billing Start Billing End Number of Energy Consumption (GJ) Product Ch Delivery Cha Taxes Service Ch: Total A2-57601 1011 LGS 2016-01-01 2016-01-31 31 309.1 $ 772.83 $ 927.39 $ 85.01 $ 180.00 $ 1,965.23 A2-57601 1011 LGS 2016-02-01 2016-02-29 29 305.3 $ 763.30 $ 915.96 $ 83.96 $ 180.00 $ 1,943.22 A2-57601 1011 LGS 2016-03-01 2016-03-30 31 226.9 $ 567.37 $ 680.84 $ 62.41 $ 180.00 $ 1,490.62 A2-57601 1011 LGS 2016-04-01 2016-04-30 30 208.8 $ 521.97 $ 626.37 $ 57.42 $ 180.00 $ 1,385.76 A2-57601 1011 LGS 2016-05-01 2016-05-31 31 244.8 $ 612.11 $ 734.53 $ 67.33 $ 180.00 $ 1,593.97 A2-57601 1011 LGS 2016-06-01 2016-06-30 30 178.8 $ 446.90 $ 536.28 $ 49.16 $ 180.00 $ 1,212.35 A2-57601 1011 LGS 2016-07-01 2016-07-31 31 31.0 $ 77.50 $ 93.00 $ 8.53 $ 180.00 $ 359.03 A2-57601 1011 LGS 2016-08-01 2016-08-31 31 33.4 $ 83.50 $ 100.20 9.19 $ 180.00 $ 372.89 A2-57601 1011 LGS 2016-09-01 2016-09-30 30 220.5 $ 551.21 $ 661.45 $ 60.63 $ 180.00 $ 1,453.30 A2-57601 1011 LGS 2016-10-01 2016-10-31 31 284.8 $ 711.99 $ 854.38 $ 78.32 $ 180.00 $ 1,824.69 A2-57601 1011 LGS 2016-11-01 2016-11-30 30 282.6 $ 706.51 $ 847.81 $ 77.72 $ 180.00 $ 1,812.04 A2-57601 1011 LGS 2016-12-01 2016-12-31 31 393.1 $ 982.78 $ 1,179.34 $ 108.11 $ 180.00 $ 2,450.22 A2-57601 1011 LGS 2017-01-01 2017-01-31 31 337.8 $ 844.46 $ 1,013.35 $ 92.89 $ 180.00 $ 2,130.69 A2-57601 1011 LGS 2017-02-01 2017-02-28 29 310.9 $ 777.34 $ 932.81 $ 85.51 $ 180.00 $ 1,975.65 A2-57601 1011 LGS 2017-03-01 2017-03-30 31 337.4 $ 843.43 $ 1,012.11 $ 92.78 $ 180.00 $ 2,128.32 A2-57601 1011 LGS 2017-04-01 2017-04-30 30 242.1 $ 605.32 $ 726.39 $ 66.59 $ 180.00 $ 1,578.29 A2-57601 1011 LGS 2017-05-01 2017-05-31 31 256.0 $ 639.93 $ 767.92 $ 70.39 $ 180.00 $ 1,658.25 A2-57601 1011 LGS 2017-06-01 2017-06-30 30 202.5 $ 506.30 $ 607.56 $ 55.69 $ 180.00 $ 1,349.56 A2-57601 1011 LGS 2017-07-01 2017-07-31 31 29.4 $ 73.50 $ 88.20 $ 8.09 $ 180.00 $ 349.79 A2-57601 1011 LGS 2017-08-01 2017-08-31 31 31.4 $ 78.50 $ 94.20 8.64 $ 180.00 $ 361.34 A2-57601 1011 LGS 2017-09-01 2017-09-30 30 223.7 $ 559.22 $ 671.07 $ 61.51 $ 180.00 $ 1,471.80 A2-57601 1011 LGS 2017-10-01 2017-10-31 31 244.2 $ 610.58 $ 732.70 $ 67.16 $ 180.00 $ 1,590.44 A2-57601 1011 LGS 2017-11-01 2017-11-30 30 309.7 $ 774.14 $ 928.97 $ 85.16 $ 180.00 $ 1,968.27 A2-57601 1011 LGS 2017-12-01 2017-12-31 31 362.4 $ 906.12 $ 1,087.34 $ $ 99.67 $ 180.00 $ 2,273.13Start Date End Date Occupied ( Comments 2016-01-01 2016-01-31 241 2016-02-01 2016-02-29 256 2016-03-01 2016-03-30 245 2016-04-01 2016-04-30 249 2016-05-01 2016-05-31 252 2016-06-01 2016-06-30 31 Mostly unoccupied during summer 2016-07-01 2016-07-31 39 Mostly unoccupied during summer 2016-08-01 2016-08-31 251 0 2016-09-01 2016-09-30 271 2016-10-01 2016-10-31 255 2 2016-11-01 2016-11-30 252 W 2016-12-01 2016-12-31 218 Short christmas break 4 2017-01-01 2017-01-31 220 5 2017-02-01 2017-02-28 265 6 2017-03-01 2017-03-30 244 7 2017-04-01 2017-04-30 249 8 2017-05-01 2017-05-31 248 9 2017-06-01 2017-06-30 45 Mostly unoccupied during summer 0 2017-07-01 2017-07-31 32 Mostly unoccupied during summer 2017-08-01 2017-08-31 249 2 2017-09-01 2017-09-30 253 3 2017-10-01 2017-10-31 246 4 2017-11-01 2017-11-30 270 5 2017-12-01 2017-12-31 218 Short christmas break 6
Step by Step Solution
There are 3 Steps involved in it

Get step-by-step solutions from verified subject matter experts