

Question: Develop an OC curve using Table 9A-2 a sample size of 50, and the following np values: 0.5, 1, 2, 3, 4, 5. The

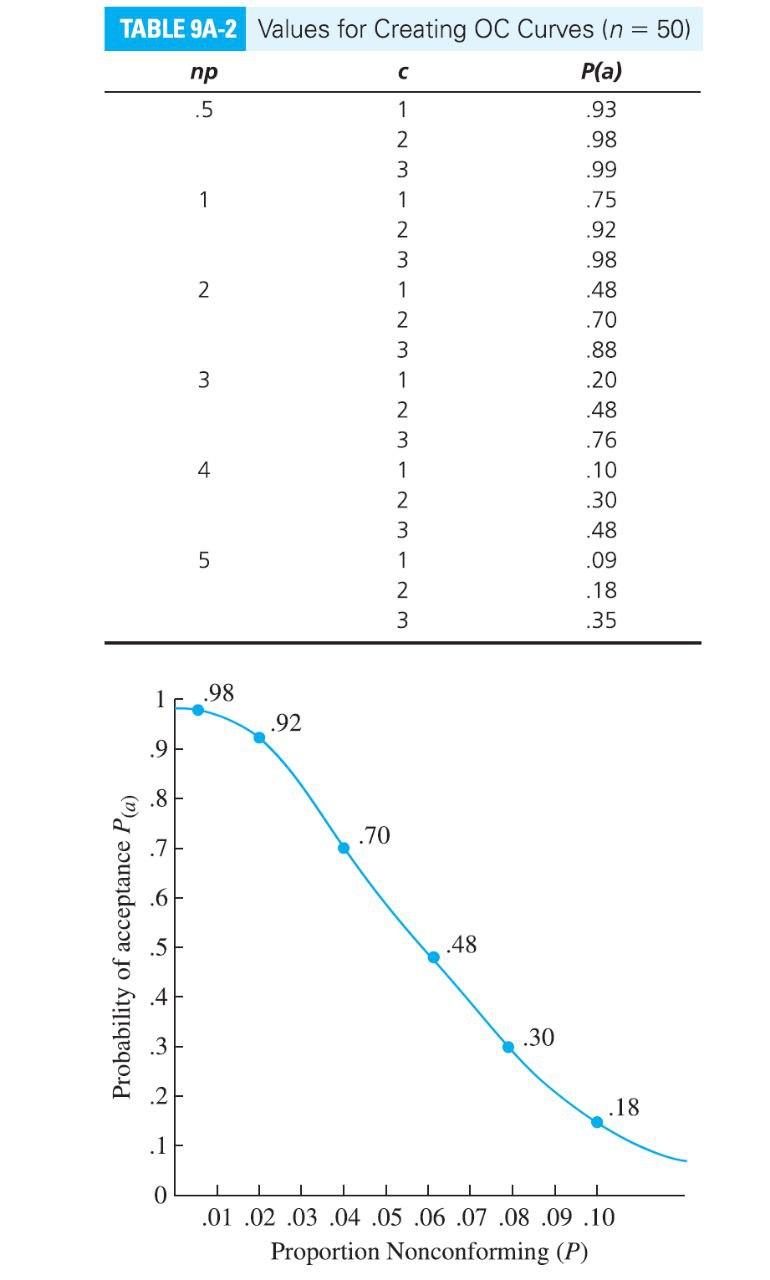
Develop an OC curve using Table 9A-2 a sample size of 50, and the following np values: 0.5, 1, 2, 3, 4, 5. The maximum acceptance number is c = 1. (Please could you use Excell and formulas to follow along) TABLE 9A-2 Values for Creating OC Curves (n = 50) P(a) 93 .98 .99 .75 .92 .98 .48 .70 .88 Probability of acceptance P(a) in 9 np .5 1 2 m 4 LO .98 .92 .70 C 312 W N - WN-WN -WN231 .48 .30 .30 .48 .09 .18 .35 .18 .01 .02 .03 .04 .05 .06 .07.08 .09.10 Proportion Nonconforming (P)
Step by Step Solution
There are 3 Steps involved in it
1 Expert Approved Answer
Step: 1 Unlock

Question Has Been Solved by an Expert!
Get step-by-step solutions from verified subject matter experts
Step: 2 Unlock
Step: 3 Unlock