

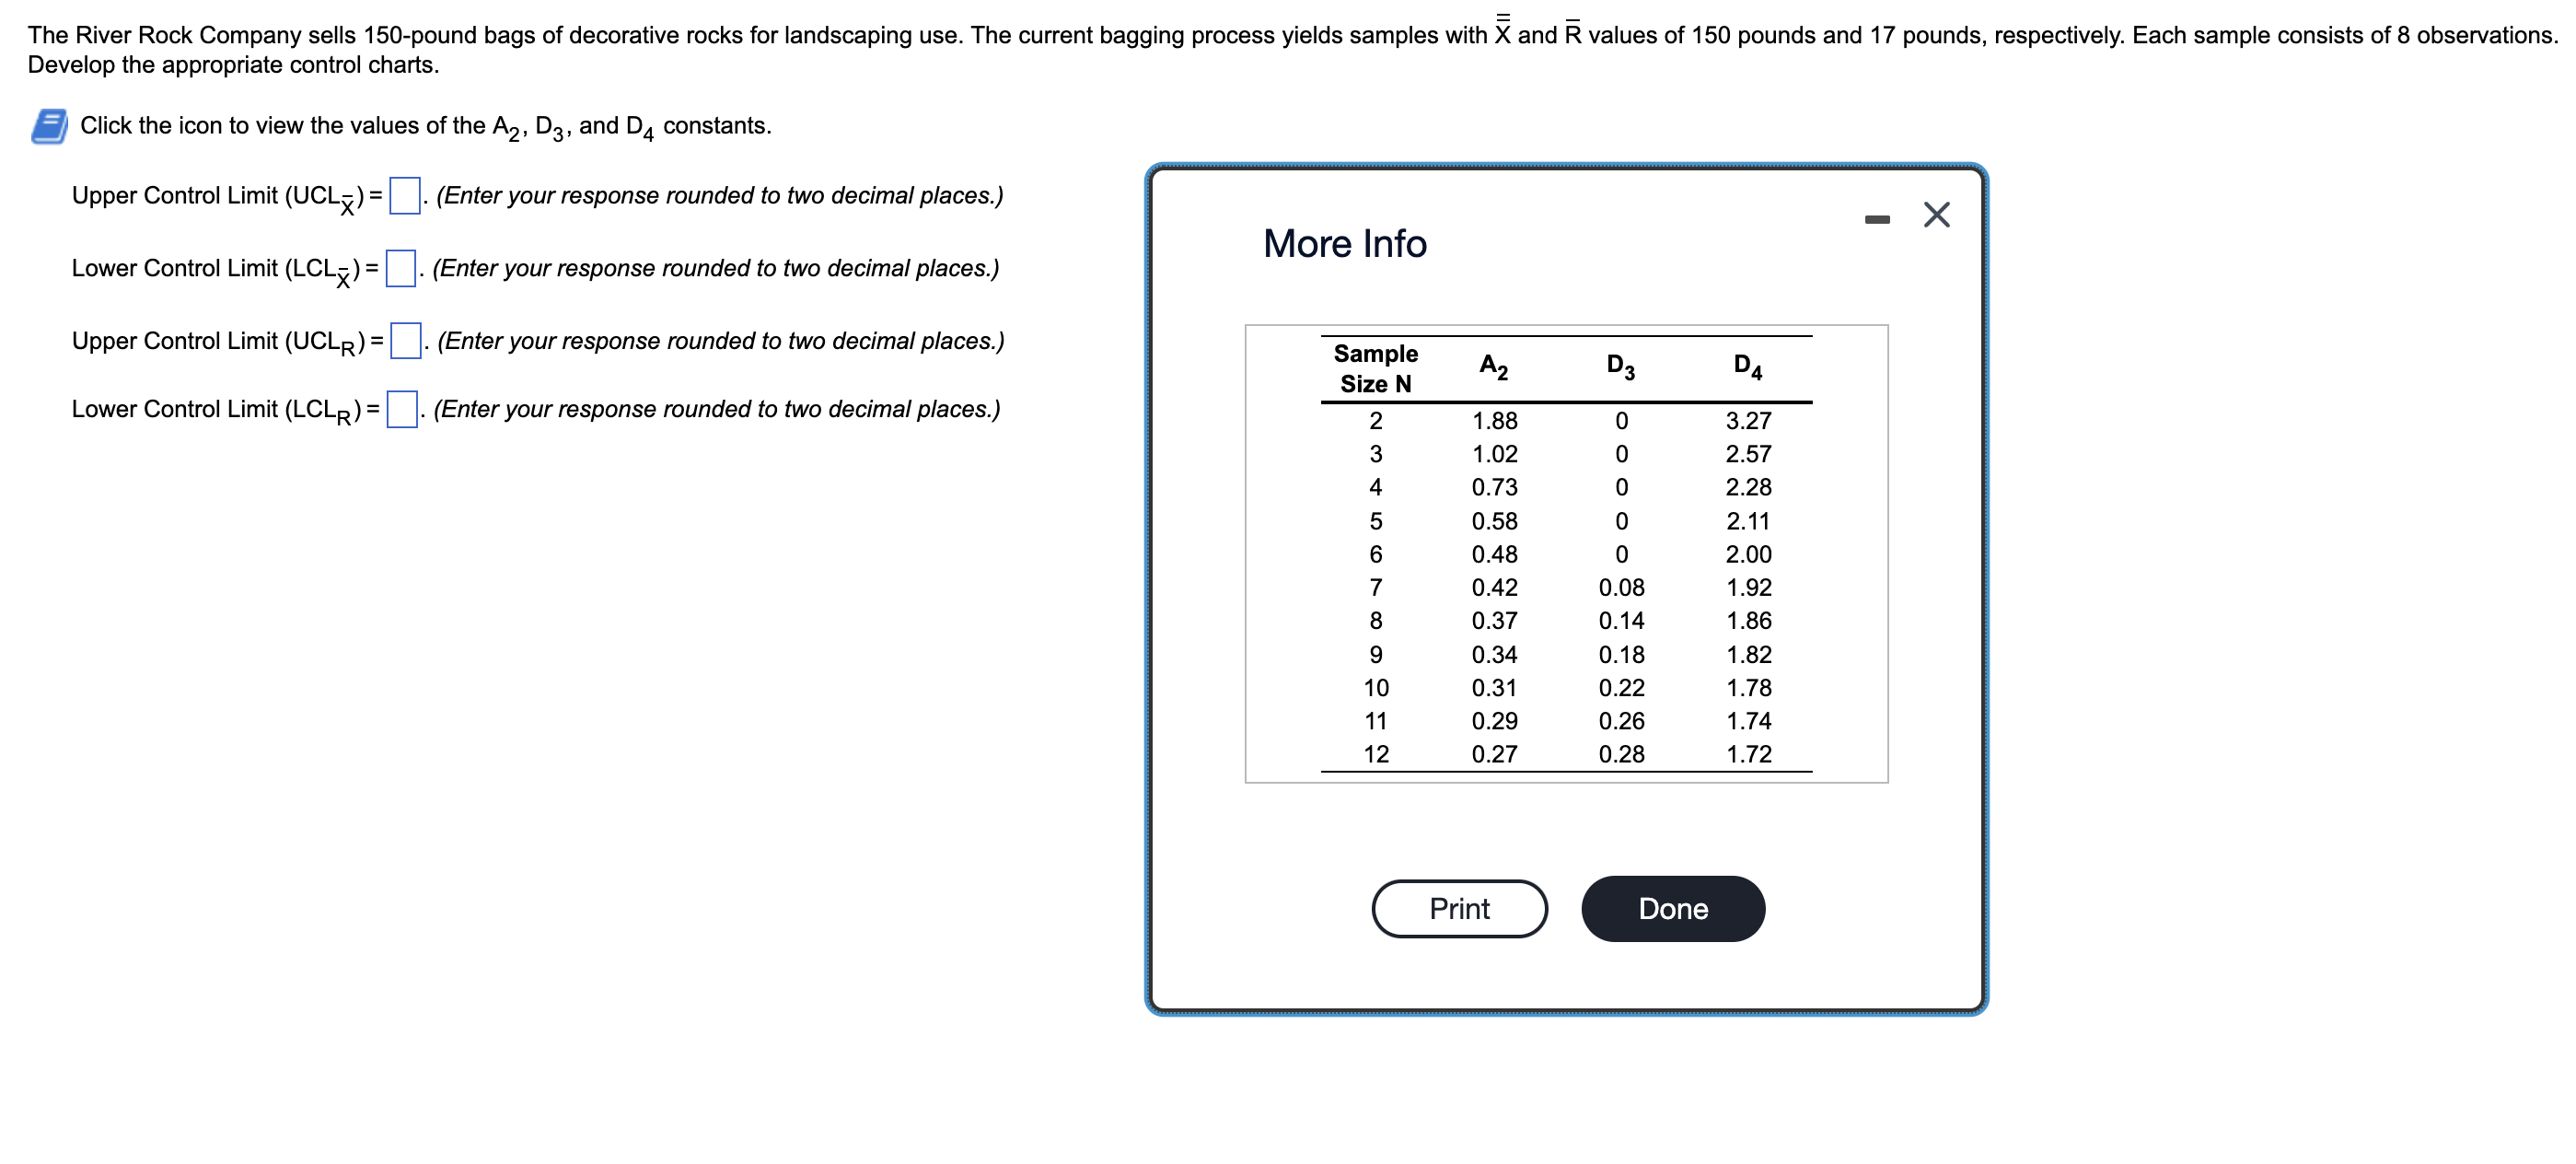
Question: Develop the appropriate control charts. Click the icon to view the values of the A 2 , D 3 , and D 4 constants. Upper
Develop the appropriate control charts.
Click the icon to view the values of the and constants.
Upper Control Limit your response rounded two decimal places.
Lower Control Limit your response rounded two decimal places.
Upper Control Limit your response rounded two decimal places.
Lower Control Limit your response rounded two decimal places.
More Info
tabletableSampleSize NADD The capacity planning function is closely linked with which two key interorganizational supply chain participants?
A
suppliers and customers
B
marketing and human resources
C
finance and accounting
D
government and APICS
Step by Step Solution
There are 3 Steps involved in it
1 Expert Approved Answer
Step: 1 Unlock

Question Has Been Solved by an Expert!
Get step-by-step solutions from verified subject matter experts
Step: 2 Unlock
Step: 3 Unlock