

Question: Develop x-bar and R Charts (calculate respective control limits) and interpret the results accordingly. nasty Peelings Table 56.1 LOS Remaining Peel (%) La Mall Population
Develop x-bar and R Charts (calculate respective control limits) and interpret the results accordingly. 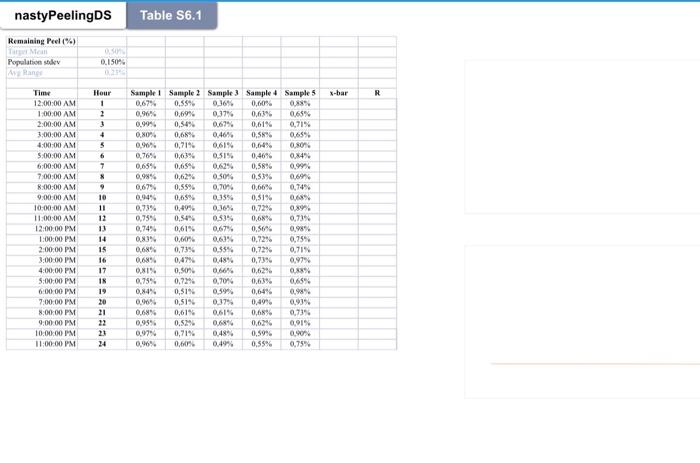
nasty Peelings Table 56.1 LOS Remaining Peel (%) La Mall Population de Ava 0.150% X-bar R ! * %990 Time 12:00:00 AM 1:00:00 AM 2:00:00 AM 3:00:00 AM 4:00:00 AM 5:00:00 AM % Hour 1 2 3 4 5 6 7 X WV 00-00-9 0.99% 6 % 050 0.99 Sample Sample Sample 3 Sample 4 Sample 5 0.67% 0.5596 0.169 0,60% 0.96 0,69% 0.37% 0,63% 0.99% 0,54% 0.67% 0,61% 0,71% O.NO 0,68% 0.46% 0,58% 0659 0.90% 0,719 0619 0,64% OSO 0765 0.519 0,46% 0X4% 0.65%. 0,65 0,5896 0.99% 0.62% O SOM 0.53% 0.6 0.67 0,59% 0,70 0,66% 0,74% 0.94% 0,65% 35 0,5196 0.68% 0.73% 0,49% 0.36 0,72% 0.89 0.75% 0,54% 0.53% 0,68% 0,739 0.74% 0,61% 067 0.00 0,61% 0,72% 0,75% 0.68 0,73% 0.35% 0,72% 0.71% 0.689. 0,479 0.48% 0,73% 0.97% 0,81 0.50 0.66% 0.62% 0,75% 0,748 0.7014 0,6394 0,65% 0.84 0,519 0.39% 0,64% 0.98 0.00 0,519 0.37% 0,499 0,93% 0,6% 0,61% 06146 0,65 0,73 0.95% 0.52 0,6246 0.97% 0,7194 0.48% 0,5996 0.90 09 0 0.49% 0,55% 0,75 7:00:00 AM 8:00:00 AM 9:00:00 AM 10-00-00 AM 11:00:00 AM 12:00:00 PM 1:00:00 PM 2:00:00 PM 3:00:00 PM 4:00:00 PM 5:00:00 PM 6:00 00 PM 7:00-00 PM 8:00:00 PM 9:00:00 PM 10.00:00 PM 11:00:00 PM 10 11 12 13 14 15 16 17 SNO ENRICHE Sero % * * W 19 20 IT SS16 22 21 24
Step by Step Solution
There are 3 Steps involved in it
1 Expert Approved Answer
Step: 1 Unlock

Question Has Been Solved by an Expert!
Get step-by-step solutions from verified subject matter experts
Step: 2 Unlock
Step: 3 Unlock