

Question: Developing and interpreting an R chart A production process may be out of control because its mean or variance or both are changing over time.
Developing and interpreting an chart
A production process may be out of control because its mean or variance or both are changing over time. The quality control manager at Just for
Kicks, the manufacturer of Silly String, develops a control chart to detect changes in the process variance.
A random sample of cans of Silly String is pulled from the production line each shift. Each can is tested in the aerosol lab to obtain its spray rate
measured in grams per second and the sample range for each sample is computed.
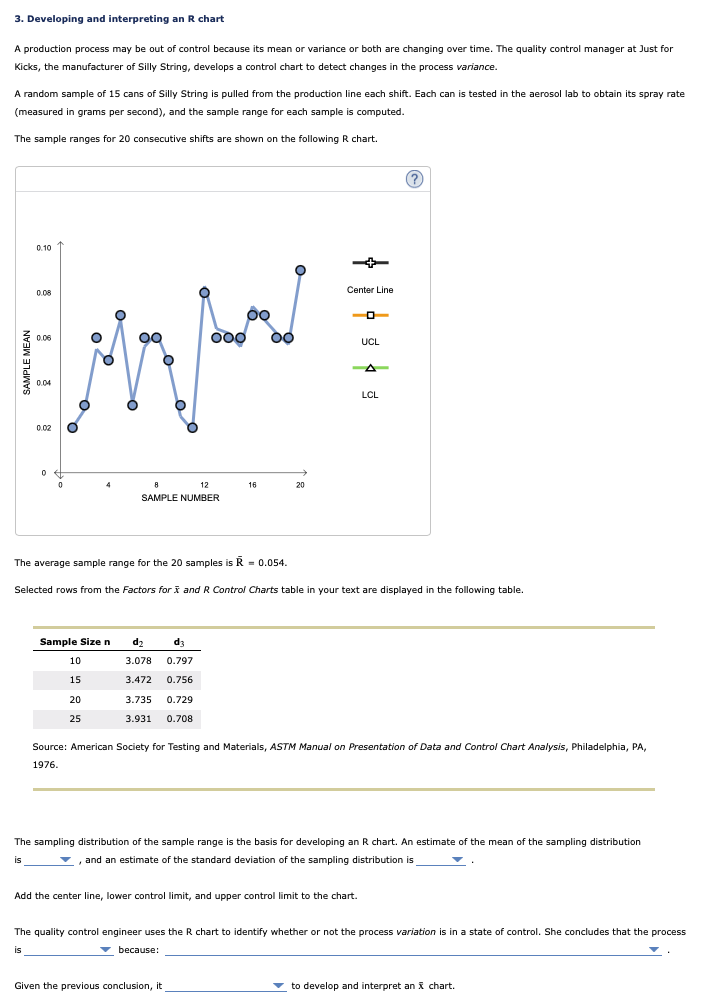
The sample ranges for consecutive shifts are shown on the following chart.
The average sample range for the samples is
Selected rows from the Factors for and Control Charts table in your text are displayed in the following table.
Source: American Society for Testing and Materials, ASTM Manual on Presentation of Data and Control Chart Analysis, Philadelphia, PA
The sampling distribution of the sample range is the basis for developing an chart. An estimate of the mean of the sampling distribution
i and an estimate of the standard deviation of the sampling distribution is
Add the center line, lower control limit and upper control limit to the chart.
The quality control engineer uses the chart to identify whether or not the process variation is in a state of control. She concludes that the process
is because:
Given the previous conclusion, it
to develop and interpret an chart.
Step by Step Solution
There are 3 Steps involved in it
1 Expert Approved Answer
Step: 1 Unlock

Question Has Been Solved by an Expert!
Get step-by-step solutions from verified subject matter experts
Step: 2 Unlock
Step: 3 Unlock