

Question: Dhillon, Shilling, and Sirmans ( Choosing between Fixed and Adjustable Rate Mortgages, Journal of Money, Credit, and Banking, 19(1), 1987, 260-267) estimate a probit
Dhillon, Shilling, and Sirmans ("Choosing between Fixed and Adjustable Rate Mortgages," Journal of Money, Credit, and Banking, 19(1), 1987, 260-267) estimate a probit model designed to explain the choice by homebuyers of fixed versus adjustable rate mortgages. They use 78 observations from a bank in Baton Rouge, Louisiana, taken over the period January 1983 to February 1984. These data are contained in the filesirmans.dat. The explanatory variables, and their anticipated signs, are FIXRATE (+)=fixed interest rate; MARGIN (-)=the variable rate-the fixed rate; YIELD (-) = the ten-year Treasury rate less the one-year rate; MATURITY (-) = ratio of maturities on adjustable to fixed rates; POINTS(-) = ratio of points paid on an adjustable mortgage to those paid on a fixed rate mortgage; NETWORTH (+) = borrower's net worth.
- Obtain the least square estimates of the linear probability model explaining the choice of an adjustable mortgage, using the explanatory variables listed above. Obtain the predicted values from this estimation. Are the signs consistent with expectation? Are the predicted values between zero and one?
- Estimate the model of mortgage choice using probit. Are the signs consistent with expectations? Are the estimated coefficients statistically significant?
- Using the probit estimates from part (b), estimate the probability p hat of choosing an adjustable rate mortgage for each sample observation. What percentage of the outcomes do we successfully predict, using the rule that if p?0.5 , we predict that an adjustable rate mortgage will be chosen?
SAS data was ran and posted below
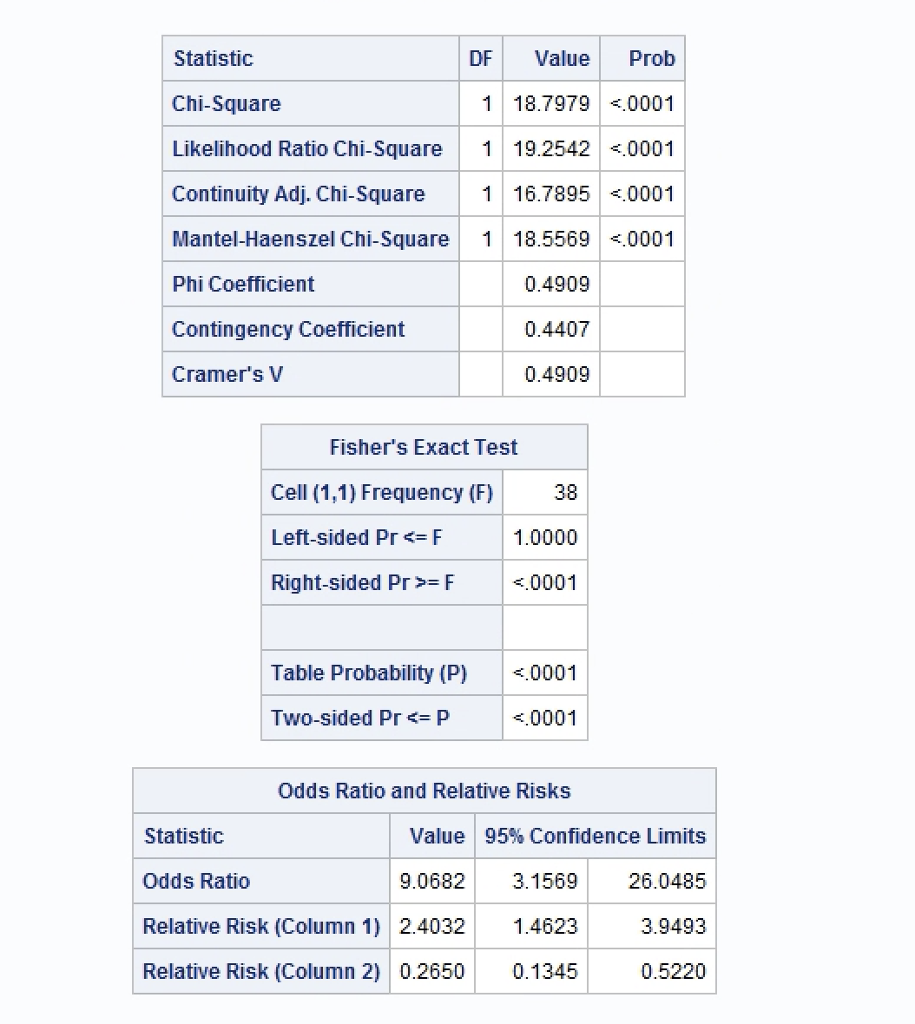
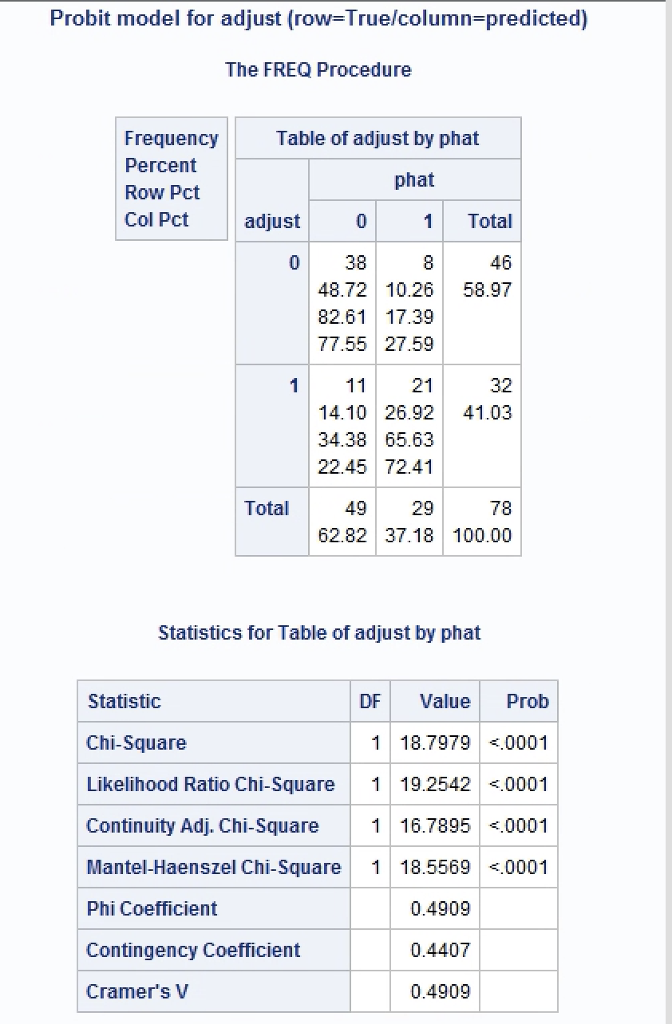
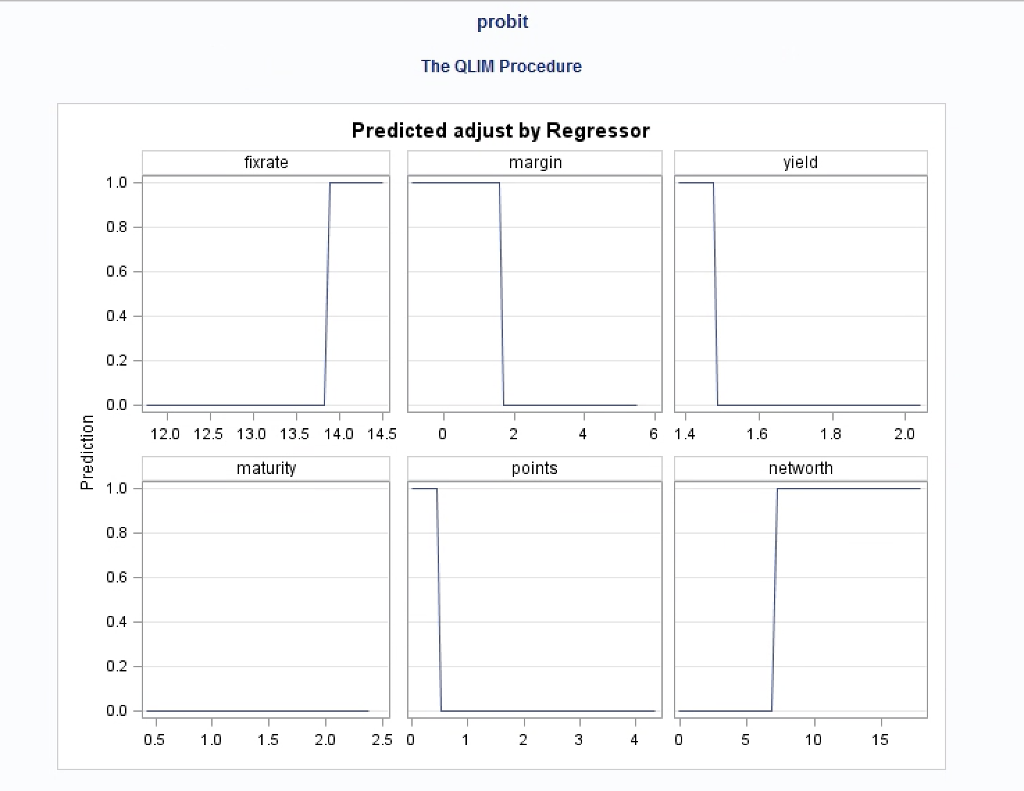
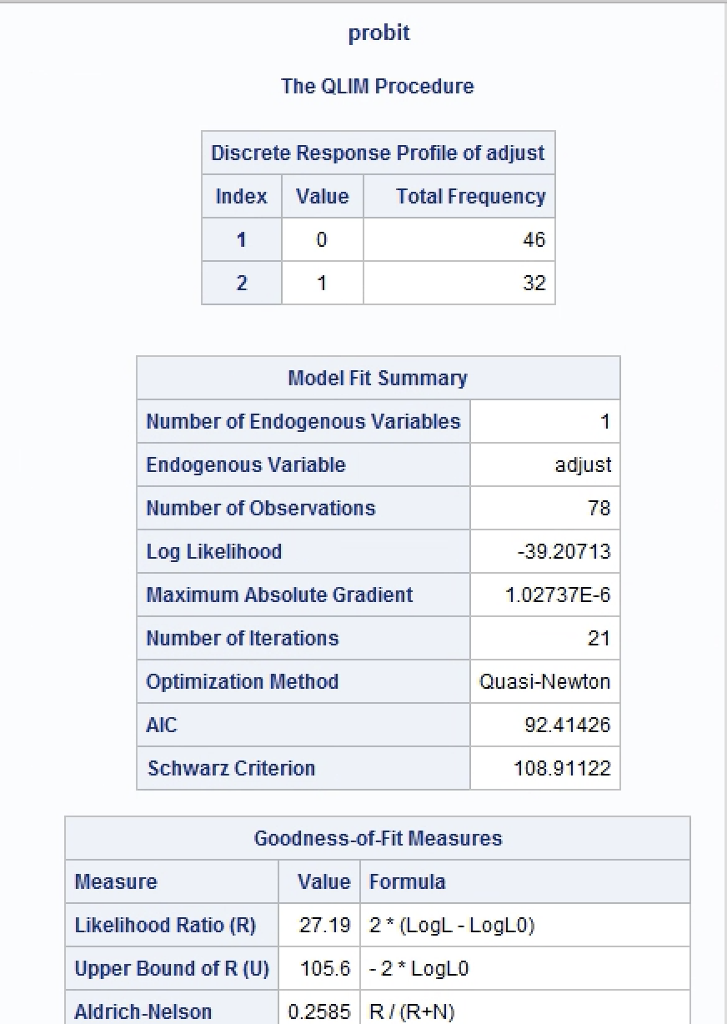
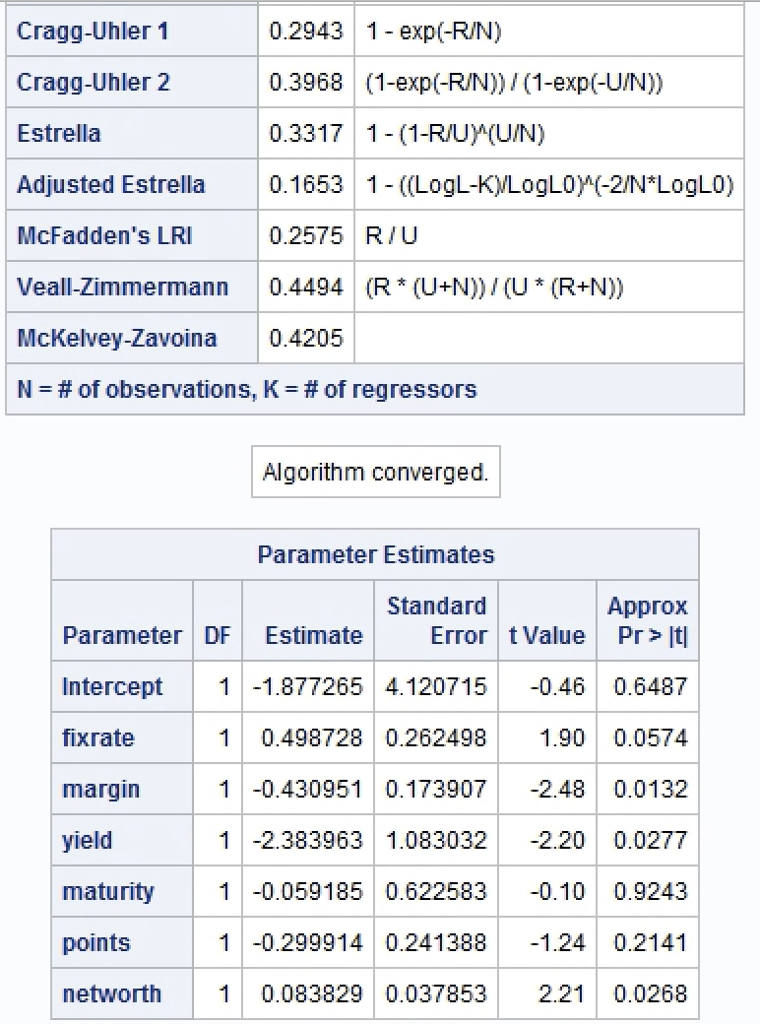
Statistic DF Value Prob Chi-Square 1 18.7979 <.0001 likelihood ratio chi-square continuity adj. mantel-haenszel phi coefficient contingency cramer v fisher exact test cell frequency left-sided pr right-sided>=F <.0001 table probability two-sided pr p odds ratio and relative risks statistic value confidence limits risk model for adjust the freq procedure frequency of by phat percent row pct col total statistics df prob chi-square likelihood continuity adj. mantel-haenszel phi coefficient contingency cramer v qlim discrete response profile index fit summary number endogenous variables variable observations log maximum absolute gradient iterations optimization method quasi-newton aic schwarz criterion goodness-of-fit measures measure formula loglo upper bound r aldrich-nelson exp cragg-uhler estrella adjusted mcfadden lri veall-zimmermann mckelvey-zavoina n="#" k="#" regressors algorithm converged. parameter estimates standard approx estimate error t> It Intercept 1 -1.877265 4.120715 -0.46 0.6487 fixrate 1 0.498728 0.262498 1.90 0.0574 margin 1 -0.430951 0.173907 -2.48 0.0132 yield 1 -2.383963 1.083032 -2.20 0.0277 maturity 1 -0.059185 0.622583 -0.10 0.9243 points 1 -0.299914 0.241388 -1.24 0.2141 networth 1 0.083829 0.037853 2.21 0.0268
Step by Step Solution
There are 3 Steps involved in it

Get step-by-step solutions from verified subject matter experts