

Question: Did revenue increase or decrease over the last year? What reason did they change? What are the percentage of revenue growth? DId total assets increase
Did revenue increase or decrease over the last year? What reason did they change?
What are the percentage of revenue growth?
DId total assets increase or decrease? What were the primary reason for the change in total assets. What are asset growth
What were the three most signficant soruces of cash inflow. And what were the three most signficant uses of cash
write a 250-word analysis of the Income Statement, Balance Sheet, and Statement of Cash Flows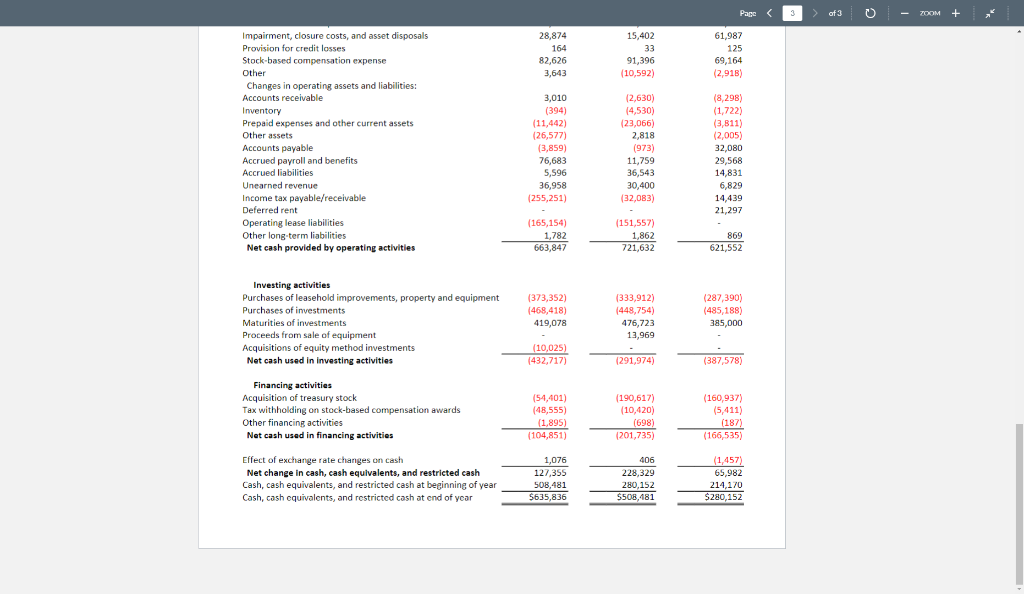
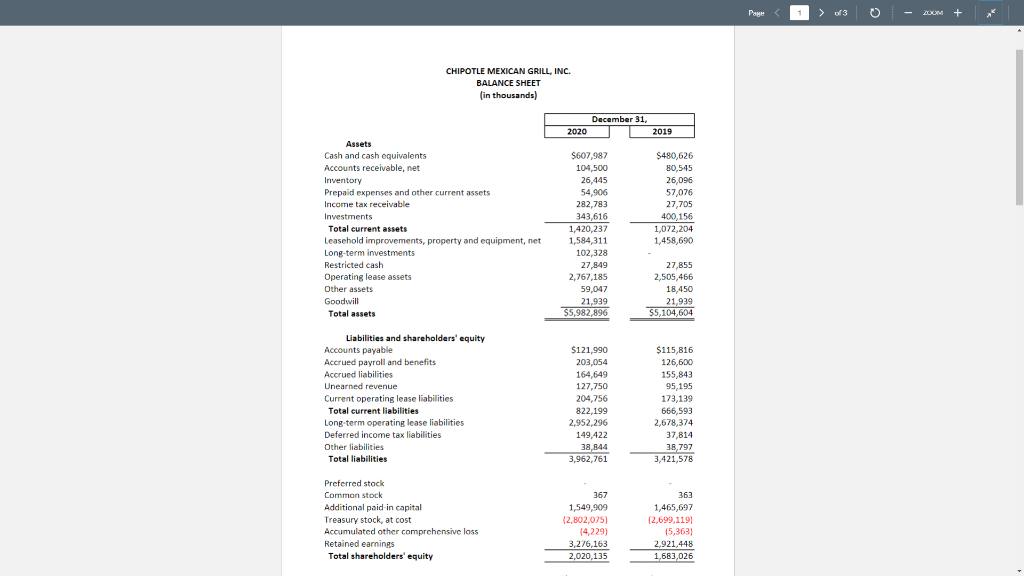
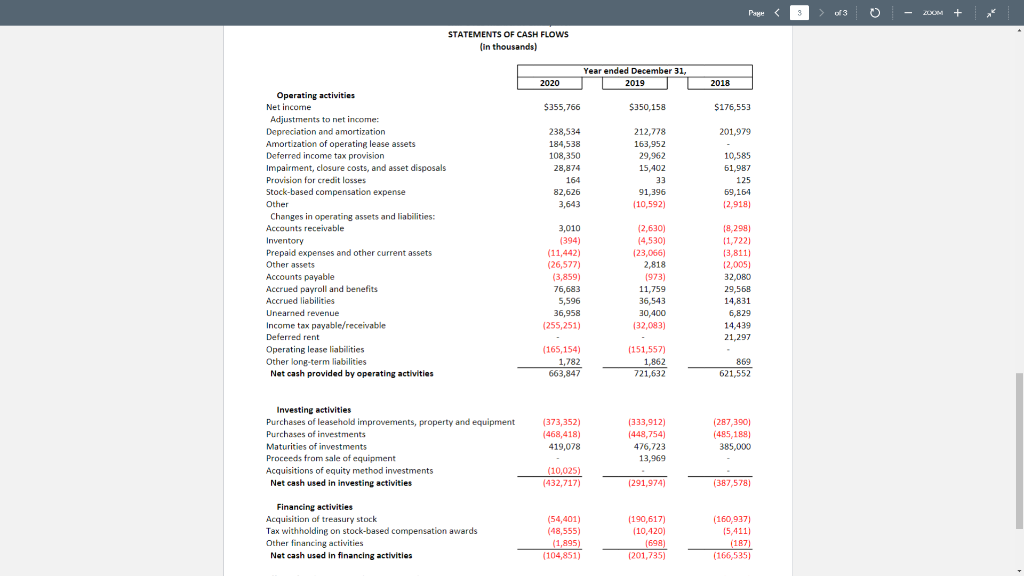
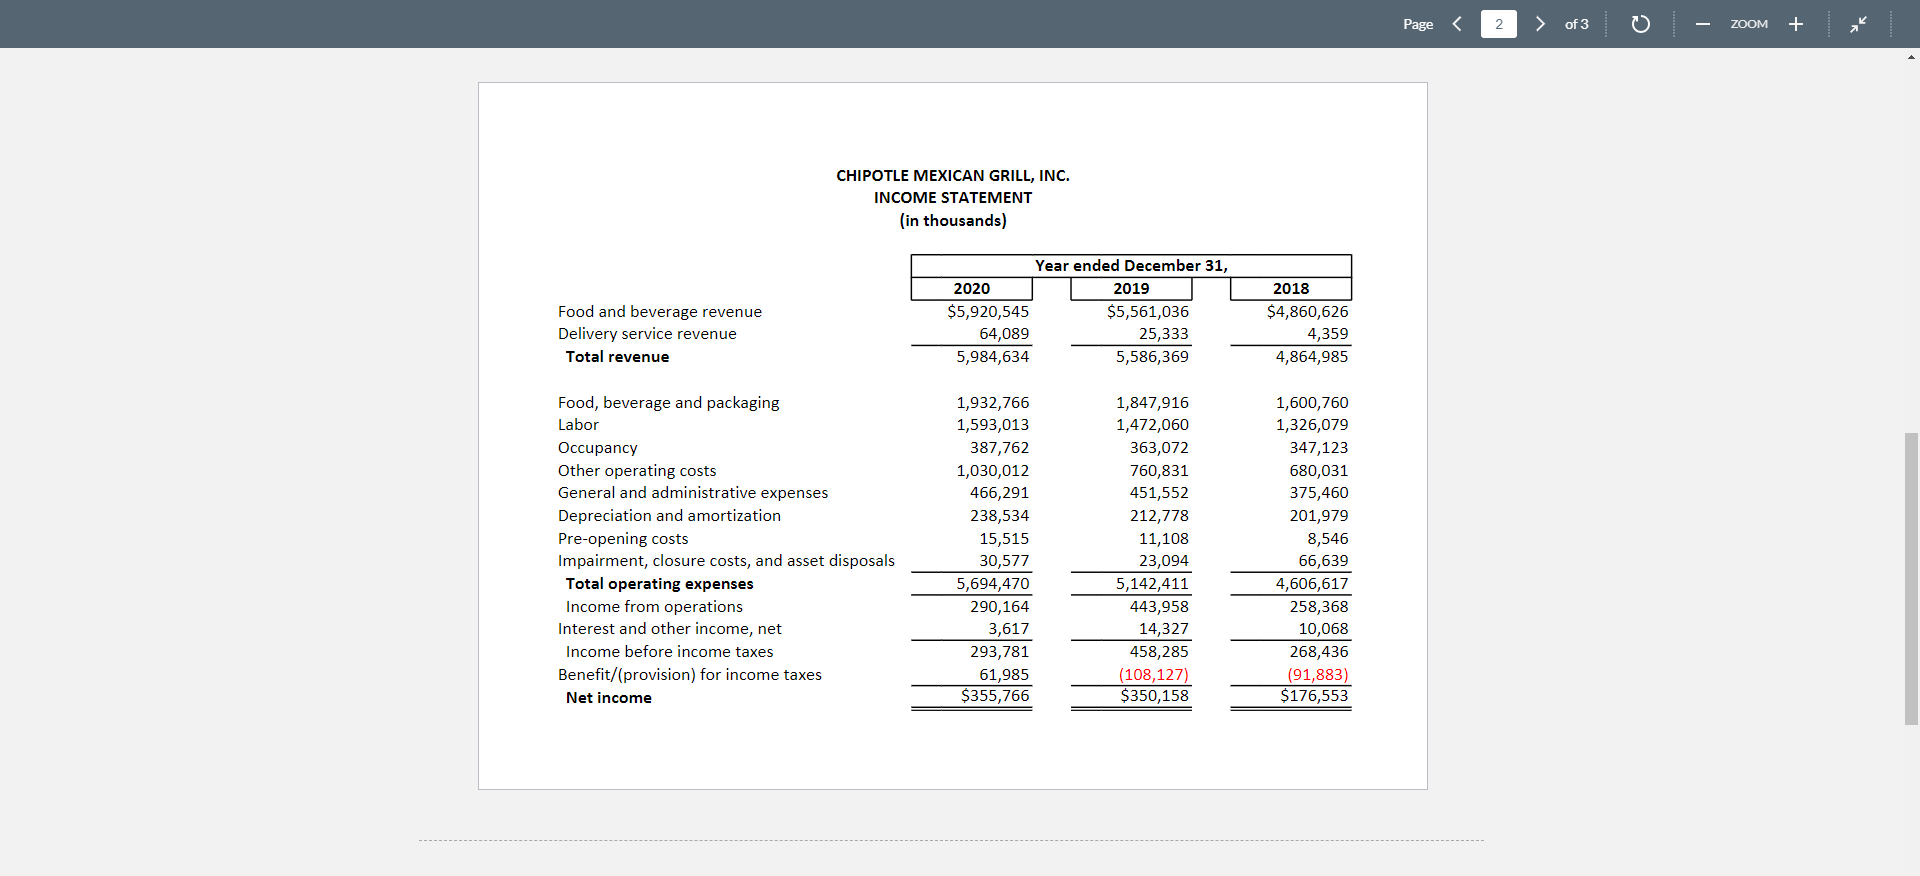
Page of 3 - 200M + CHIPOTLE MEXICAN GRILL, INC. BALANCE SHEET in thousands) December 31, 2020 2019 Assets Cash and cash equivalents Accounts receivable, net Inventory Prepaid expenses and other current assets Income tax receivable Investments Total current assets Leasehold improvements, property and equipment, net Long-term investments Restricted cash Operating lease assets Other assets Goodwill Total assets S607,987 104,500 26,445 54,906 282,783 343,616 1,420,237 1,584,311 102,328 27,849 2,767,185 59,047 21,939 $5,982,896 $480,626 80,545 26,096 57,076 27,705 400, 156 1,072,204 1,458,690 27,855 2,505,466 18,450 21,939 $5,104,604 Liabilities and shareholders' equity Accounts payable Accrued payroll and benefits Accrued liabilities Unearned revenue Current operating lease liabilities Total current liabilities Long-term operating lease liabilities Deferred income tax liabilities Other liabilities Total liabilities $121,990 203,054 164,649 127,750 204,756 822,199 2,952,296 149,422 38,844 3,962,761 $115,816 126,600 155,843 95,195 173,139 666,593 2,678,374 37,814 38,797 3,421,578 Preferred stock Common stock Additional paid in capital Treasury stock, at cost Accumulated other comprehensive loss Retained earnings Total shareholders' equity 367 1,549,909 12,802,075) (4,229) 3,276,163 2,020,135 363 1,465,697 (2,699,119) 15,3631 2,921,448 1,683,026 Page 9 > of 3 - 200M + STATEMENTS OF CASH FLOWS in thousands) ) Year ended December 31, 2019 2020 2018 $355,766 $350,158 $ $176,553 201,979 238,534 184,538 108,350 28,874 164 82,626 3,643 212,778 163,952 29,962 15,402 33 91,396 (10,592) 10,585 51,987 125 59,164 12,918) Operating activities Net Income Adjustments to net income: Depreciation and amortization Amortization of operating lease assets Deferred income tax provision Impairment, closure costs, and asset disposals Provision for credit losses Stock-based compensation expense Other Changes in operating assets and liabilities: Accounts receivable Inventory Prepaid expenses and other current assets Other assets Accounts payable Accrued payroll and benefits Accrued liabilities Unearned revenue Income tax payable/receivable Deferred rent Operating lease liabilities Other long-term liabilities Net cash provided by operating activities 3,010 (394) (11,442) (26,577) (3,859) 76,683 5,596 36,958 (255,251) (2,630) 14,530) (23,066) 2,818 1973) 11,759 36,543 30,400 (32,083 18,298) 11,722) 13,811) 12,005) 32,080 29,568 14,831 6,829 14,439 21,297 (165,154) 1,782 663,847 (151,557) 1,862 721,632 869 621,552 Investing activities Purchases of leasehold improvements, property and equipment Purchases of investments Maturities of investments Proceeds from sale of equipment Acquisitions of equity method investments Net cash used in investing activities (373,352) (468,418) 419,078 (333,912) (448,754) 476,723 13,969 (287,3901 (485,188) 385,000 (10,025) (432,717) 1291,974) (387,578) Financing activities Acquisition of treasury stock Tax withholding on stock-based compensation awards Other financing activities Net cash used in financing activities (54,401) (48,555) (1,895) (104,851) (190,617) (10,420) (698) (201,735) (160,9371 15,411) (1871 (166,585) Page 2 > of 3 ZOOM + CHIPOTLE MEXICAN GRILL, INC. INCOME STATEMENT (in thousands) Food and beverage revenue Delivery service revenue Total revenue Year ended December 31, 2020 2019 $5,920,545 $5,561,036 64,089 25,333 5,984,634 5,586,369 2018 $4,860,626 4,359 4,864,985 Food, beverage and packaging Labor Occupancy Other operating costs General and administrative expenses Depreciation and amortization Pre-opening costs Impairment, closure costs, and asset disposals Total operating expenses Income from operations Interest and other income, net Income before income taxes Benefit/(provision) for income taxes Net income 1,932,766 1,593,013 387,762 1,030,012 466,291 238,534 15,515 30,577 5,694,470 290,164 3,617 293,781 61,985 $355,766 1,847,916 1,472,060 363,072 760,831 451,552 212,778 11,108 23,094 5,142,411 443,958 14,327 458,285 (108,127) $350,158 1,600,760 1,326,079 347,123 680,031 375,460 201,979 8,546 66,639 4,606,617 258,368 10,068 268,436 (91,883) $176,553 Page of 3 - 200M + CHIPOTLE MEXICAN GRILL, INC. BALANCE SHEET in thousands) December 31, 2020 2019 Assets Cash and cash equivalents Accounts receivable, net Inventory Prepaid expenses and other current assets Income tax receivable Investments Total current assets Leasehold improvements, property and equipment, net Long-term investments Restricted cash Operating lease assets Other assets Goodwill Total assets S607,987 104,500 26,445 54,906 282,783 343,616 1,420,237 1,584,311 102,328 27,849 2,767,185 59,047 21,939 $5,982,896 $480,626 80,545 26,096 57,076 27,705 400, 156 1,072,204 1,458,690 27,855 2,505,466 18,450 21,939 $5,104,604 Liabilities and shareholders' equity Accounts payable Accrued payroll and benefits Accrued liabilities Unearned revenue Current operating lease liabilities Total current liabilities Long-term operating lease liabilities Deferred income tax liabilities Other liabilities Total liabilities $121,990 203,054 164,649 127,750 204,756 822,199 2,952,296 149,422 38,844 3,962,761 $115,816 126,600 155,843 95,195 173,139 666,593 2,678,374 37,814 38,797 3,421,578 Preferred stock Common stock Additional paid in capital Treasury stock, at cost Accumulated other comprehensive loss Retained earnings Total shareholders' equity 367 1,549,909 12,802,075) (4,229) 3,276,163 2,020,135 363 1,465,697 (2,699,119) 15,3631 2,921,448 1,683,026 Page 9 > of 3 - 200M + STATEMENTS OF CASH FLOWS in thousands) ) Year ended December 31, 2019 2020 2018 $355,766 $350,158 $ $176,553 201,979 238,534 184,538 108,350 28,874 164 82,626 3,643 212,778 163,952 29,962 15,402 33 91,396 (10,592) 10,585 51,987 125 59,164 12,918) Operating activities Net Income Adjustments to net income: Depreciation and amortization Amortization of operating lease assets Deferred income tax provision Impairment, closure costs, and asset disposals Provision for credit losses Stock-based compensation expense Other Changes in operating assets and liabilities: Accounts receivable Inventory Prepaid expenses and other current assets Other assets Accounts payable Accrued payroll and benefits Accrued liabilities Unearned revenue Income tax payable/receivable Deferred rent Operating lease liabilities Other long-term liabilities Net cash provided by operating activities 3,010 (394) (11,442) (26,577) (3,859) 76,683 5,596 36,958 (255,251) (2,630) 14,530) (23,066) 2,818 1973) 11,759 36,543 30,400 (32,083 18,298) 11,722) 13,811) 12,005) 32,080 29,568 14,831 6,829 14,439 21,297 (165,154) 1,782 663,847 (151,557) 1,862 721,632 869 621,552 Investing activities Purchases of leasehold improvements, property and equipment Purchases of investments Maturities of investments Proceeds from sale of equipment Acquisitions of equity method investments Net cash used in investing activities (373,352) (468,418) 419,078 (333,912) (448,754) 476,723 13,969 (287,3901 (485,188) 385,000 (10,025) (432,717) 1291,974) (387,578) Financing activities Acquisition of treasury stock Tax withholding on stock-based compensation awards Other financing activities Net cash used in financing activities (54,401) (48,555) (1,895) (104,851) (190,617) (10,420) (698) (201,735) (160,9371 15,411) (1871 (166,585) Page 2 > of 3 ZOOM + CHIPOTLE MEXICAN GRILL, INC. INCOME STATEMENT (in thousands) Food and beverage revenue Delivery service revenue Total revenue Year ended December 31, 2020 2019 $5,920,545 $5,561,036 64,089 25,333 5,984,634 5,586,369 2018 $4,860,626 4,359 4,864,985 Food, beverage and packaging Labor Occupancy Other operating costs General and administrative expenses Depreciation and amortization Pre-opening costs Impairment, closure costs, and asset disposals Total operating expenses Income from operations Interest and other income, net Income before income taxes Benefit/(provision) for income taxes Net income 1,932,766 1,593,013 387,762 1,030,012 466,291 238,534 15,515 30,577 5,694,470 290,164 3,617 293,781 61,985 $355,766 1,847,916 1,472,060 363,072 760,831 451,552 212,778 11,108 23,094 5,142,411 443,958 14,327 458,285 (108,127) $350,158 1,600,760 1,326,079 347,123 680,031 375,460 201,979 8,546 66,639 4,606,617 258,368 10,068 268,436 (91,883) $176,553
Step by Step Solution
There are 3 Steps involved in it

Get step-by-step solutions from verified subject matter experts