

Question: Direction: Answer the following problem below. Make sure to show the complete solution and answer. SHOW THE COMPLETE SOLUTIONS AND ANSWERS! Match the written scenario
Direction: Answer the following problem below. Make sure to show the complete solution and answer. SHOW THE COMPLETE SOLUTIONS AND ANSWERS!
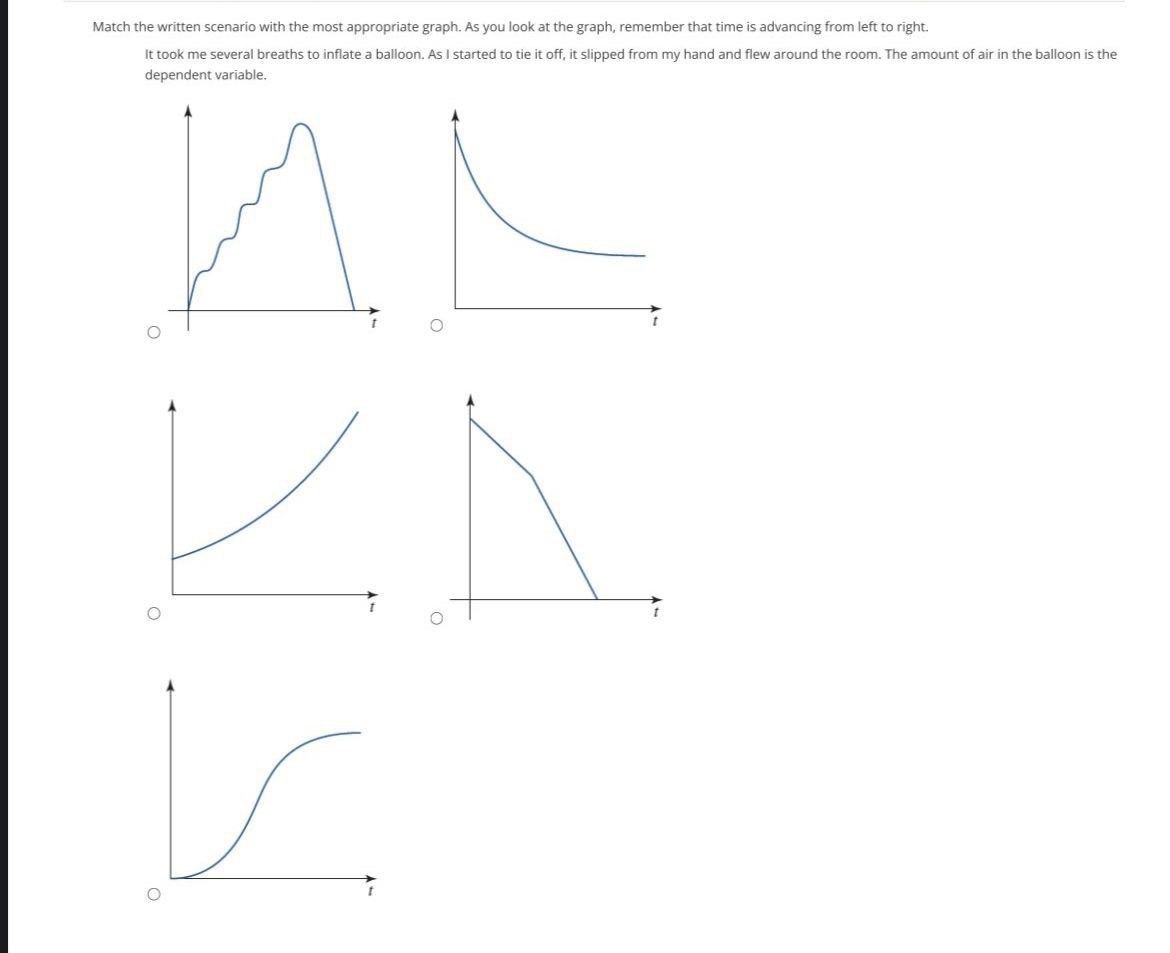

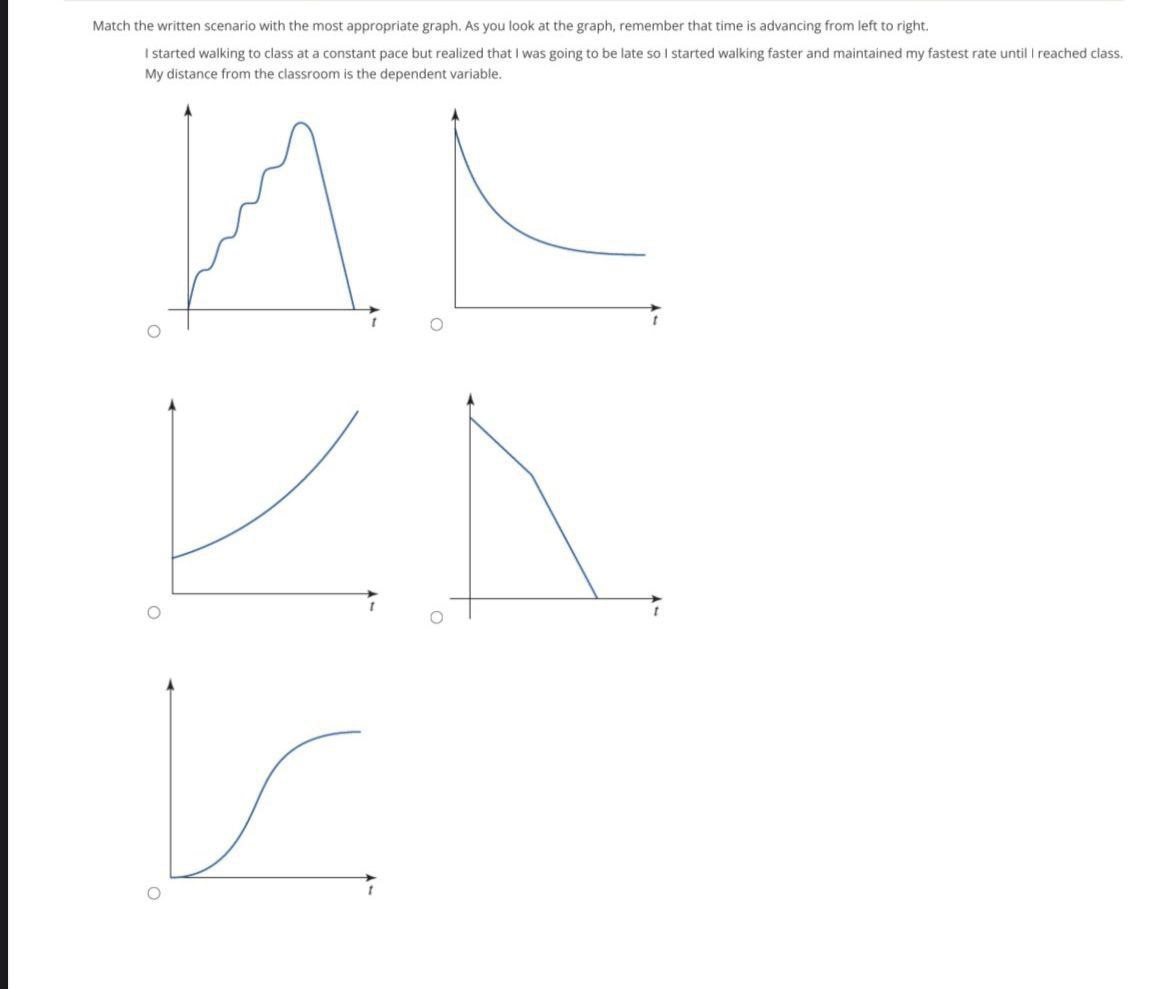
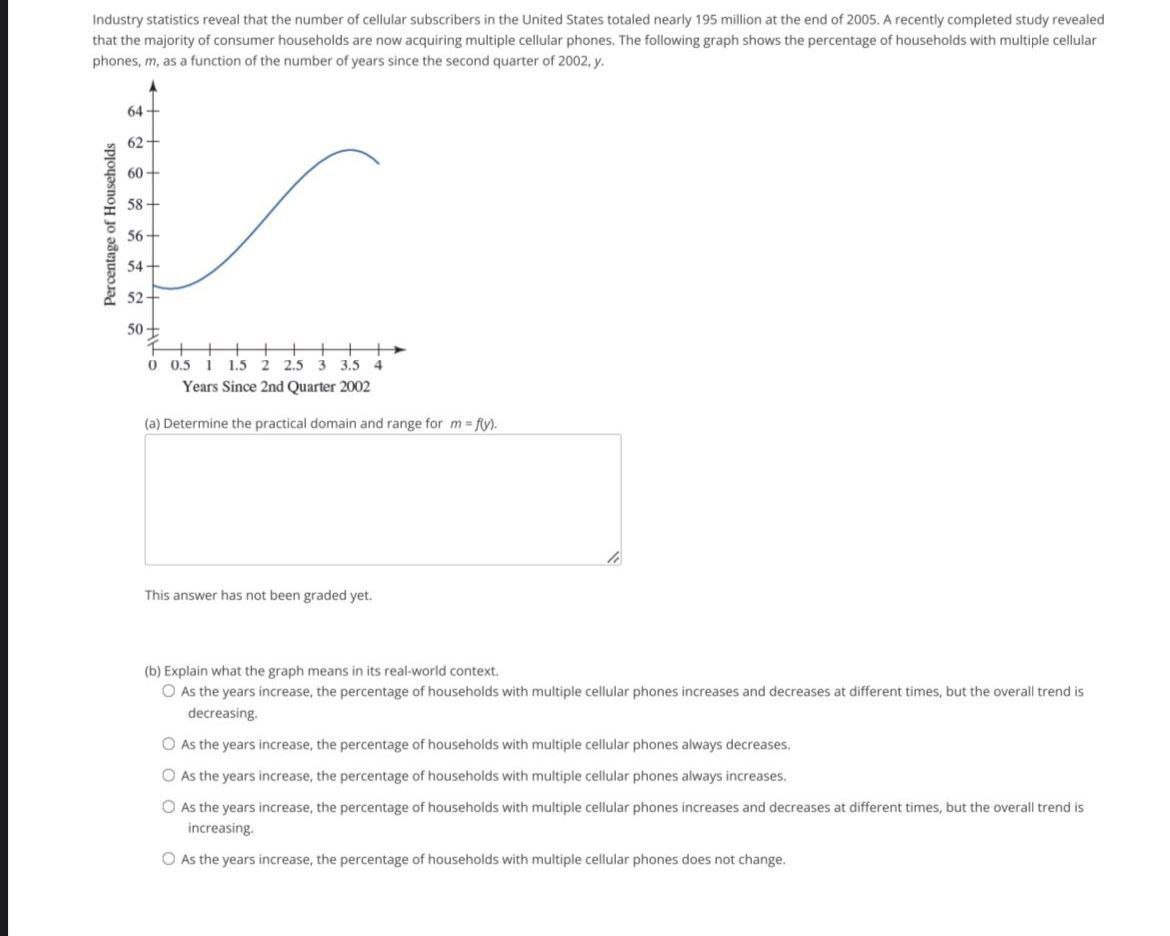
Match the written scenario with the most appropriate graph. As you look at the graph, remember that time is advancing from left to right. It took me several breaths to inflate a balloon. As I started to tie it off, it slipped from my hand and flew around the room. The amount of air in the balloon is the dependent variable. O O O O OMatch the written scenario with the most appropriate graph. As you look at the graph, remember that time is advancing from left to right. I started walking to class at a constant pace but realized that I was going to be late so I started walking faster and maintained my fastest rate until | reached class. My distance from the classroom is the dependent variable. O O OMatch the written scenario with the most appropriate graph. As you look at the graph, remember that time is advancing from left to right. I started walking to class at a constant pace but realized that I was going to be late so I started walking faster and maintained my fastest rate until | reached class. My distance from the classroom is the dependent variable. O O OIndustry statistics reveal that the number of cellular subscribers in the United States totaled nearlyI 195 million at the end of 2005. A recently completed studyr revealed that the majority of consumer households are now acquiring multiple cellular phones. The following graph shows the percentage of households with multiple cellular phones. m. as a function of the number of years since the second quarter of 2002. y. 64 62 w 53 Sr: 54 Patronage of Housd'iolds 52 so T+iiiiiii- U 0.5 I 1.3 2 2.5 3 3.5 4 YearsSinoeIonuarlerlOZ {a} Determine the practical domain and range for m =y). This answer has not been graded yet. to! Explain what [he graph means in its real-world context. i.) As the years increase, the percentage of households with multiple cellular phones increases and decreases at different times, but the overall trend is decreaSing. D As the years increase, the percentage of households with multiple cellular phones always decreases. Q As the years increase. the percentage of households with multiple cellular phones always increases. C'- As the years increase. the percentage of households With multiple cellular phones increases and decreases at different times, but the overall trend is increasing. (3 As the years increase. the percentage of households With multiple cellular phones does not change
Step by Step Solution
There are 3 Steps involved in it

Get step-by-step solutions from verified subject matter experts