

Question: Directions: 1) Create a Column Chart comparing 2021 and 2022 Sales Data for each salesperson Place the chart to the right of the table below
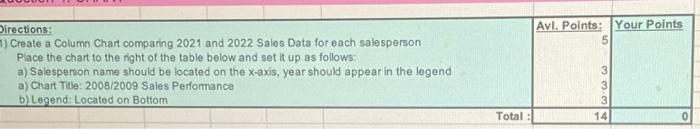
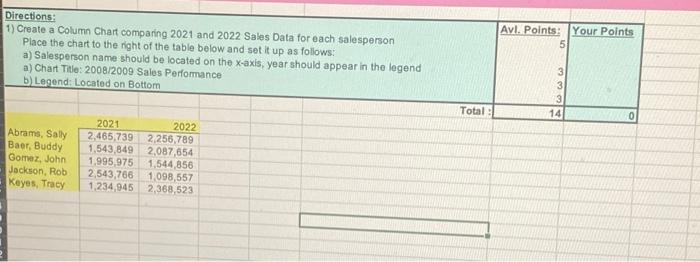
Directions: 1) Create a Column Chart comparing 2021 and 2022 Sales Data for each salesperson Place the chart to the right of the table below and set it up as follows: a) Salesperson name should be located on the x-axis, year should appear in the legend a) Chart Title: 2008/2009 Sales Performance b) Legend: Located on Bottom Total: Avl. Points: Your Points 5 3334 14 0
Directions: 1) Create a Column Chart comparing 2021 and 2022 Sales Data for each salesperson Place the chart to the right of the table below and set it up as follows: a) Salesperson name should be located on the x-axis, year should appear in the legend a) Chart Thte: 2008/2009 Sales Performance b) Legend: Located on Bottorm \begin{tabular}{l} b) Legend: Located on Bottom \\ \hline \end{tabular}
Step by Step Solution
There are 3 Steps involved in it
1 Expert Approved Answer
Step: 1 Unlock

Question Has Been Solved by an Expert!
Get step-by-step solutions from verified subject matter experts
Step: 2 Unlock
Step: 3 Unlock