

Question: Directions: Below are Observed data from an exam. The table describes the test takers whose overall scores ranked in the top 1/3, the middle 1/3
Directions: Below are Observed data from an exam. The table describes the test takers whose overall scores ranked in the top 1/3, the middle 1/3 and the bottom 1/3 along with the number of students in each group who got the item correct. Ideally, a good test item is able to discriminate between students performing well and students performing poorly on the exam (i.e., those who do well on the exam should get this item correct, and those who do not do well on the exam should get the item incorrect). Use the Chi-Square formula (

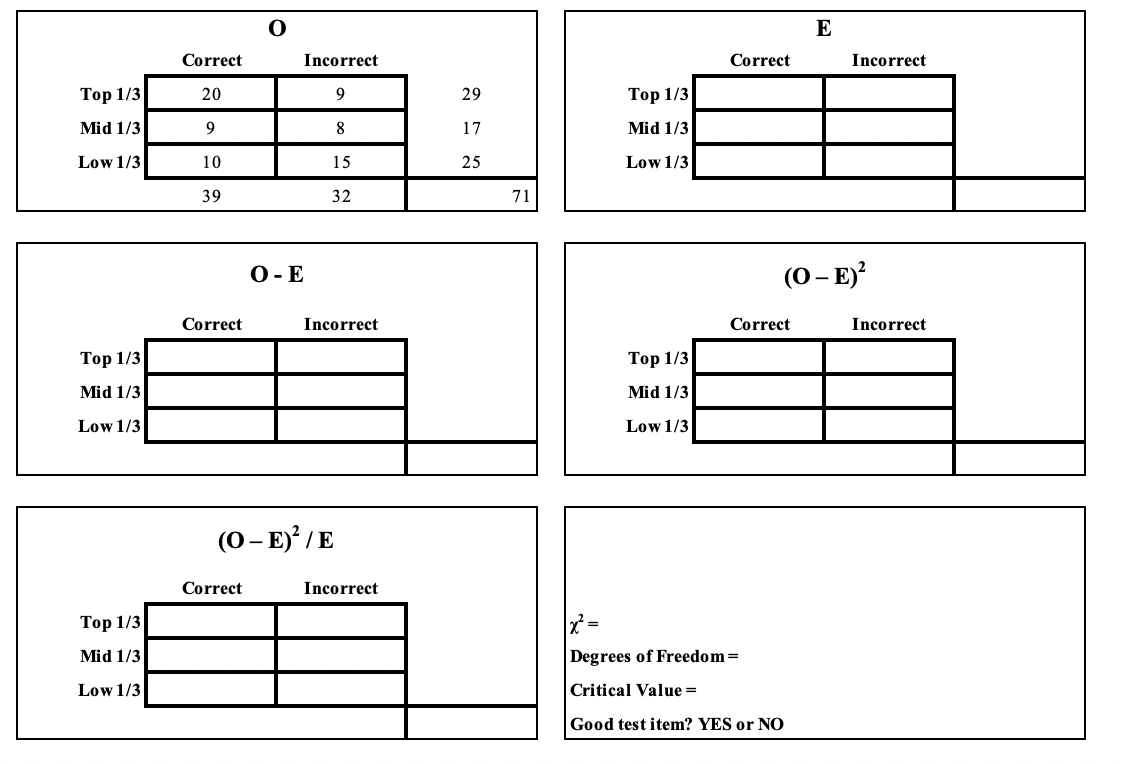
\fO E Correct Incorrect Correct Incorrect Top 1/3 20 9 29 Top 1/3 Mid 1/3 9 8 17 Mid 1/3 Low 1/3 10 15 25 Low 1/3 39 32 71 O - E (0-E) Correct Incorrect Correct Incorrect Top 1/3 Top 1/3 Mid 1/3 Mid 1/3 Low 1/3 Low 1/3 (0-E)'/E Correct Incorrect Top 1/3 X = Mid 1/3 Degrees of Freedom = Low 1/3 Critical Value = Good test item? YES or NO
Step by Step Solution
There are 3 Steps involved in it

Get step-by-step solutions from verified subject matter experts