

Question: Directions: Drag each tile to the correct box. The graph below represents the amount of water in a pool over a period of 5
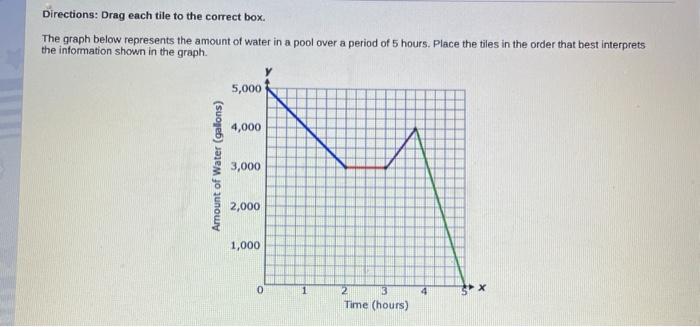
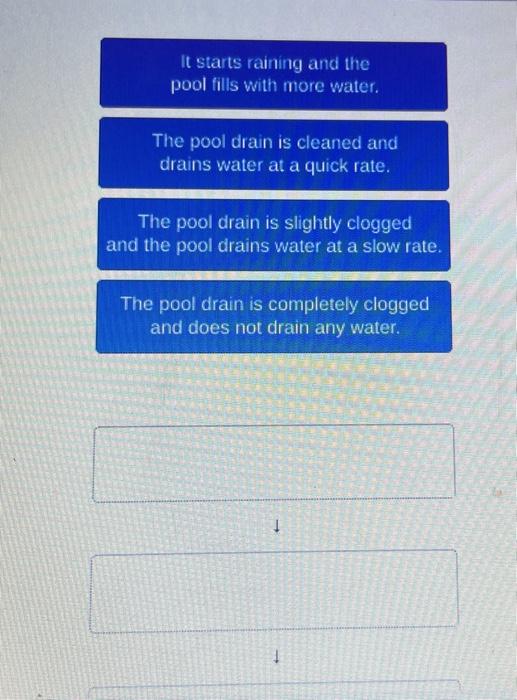
Directions: Drag each tile to the correct box. The graph below represents the amount of water in a pool over a period of 5 hours. Place the tiles in the order that best interprets the information shown in the graph. Amount of Water (gallons) 5,000 4,000 3,000 2,000 1,000 0 2 3 Time (hours) 4 X It starts raining and the pool fills with more water. The pool drain is cleaned and drains water at a quick rate. The pool drain is slightly clogged and the pool drains water at a slow rate. The pool drain is completely clogged and does not drain any water.
Step by Step Solution
3.44 Rating (154 Votes )
There are 3 Steps involved in it

Get step-by-step solutions from verified subject matter experts