

Question: Directions: For each case, plot the data on the blank graphs and determine the type of relationship between the quantities. Note: All lab data shown
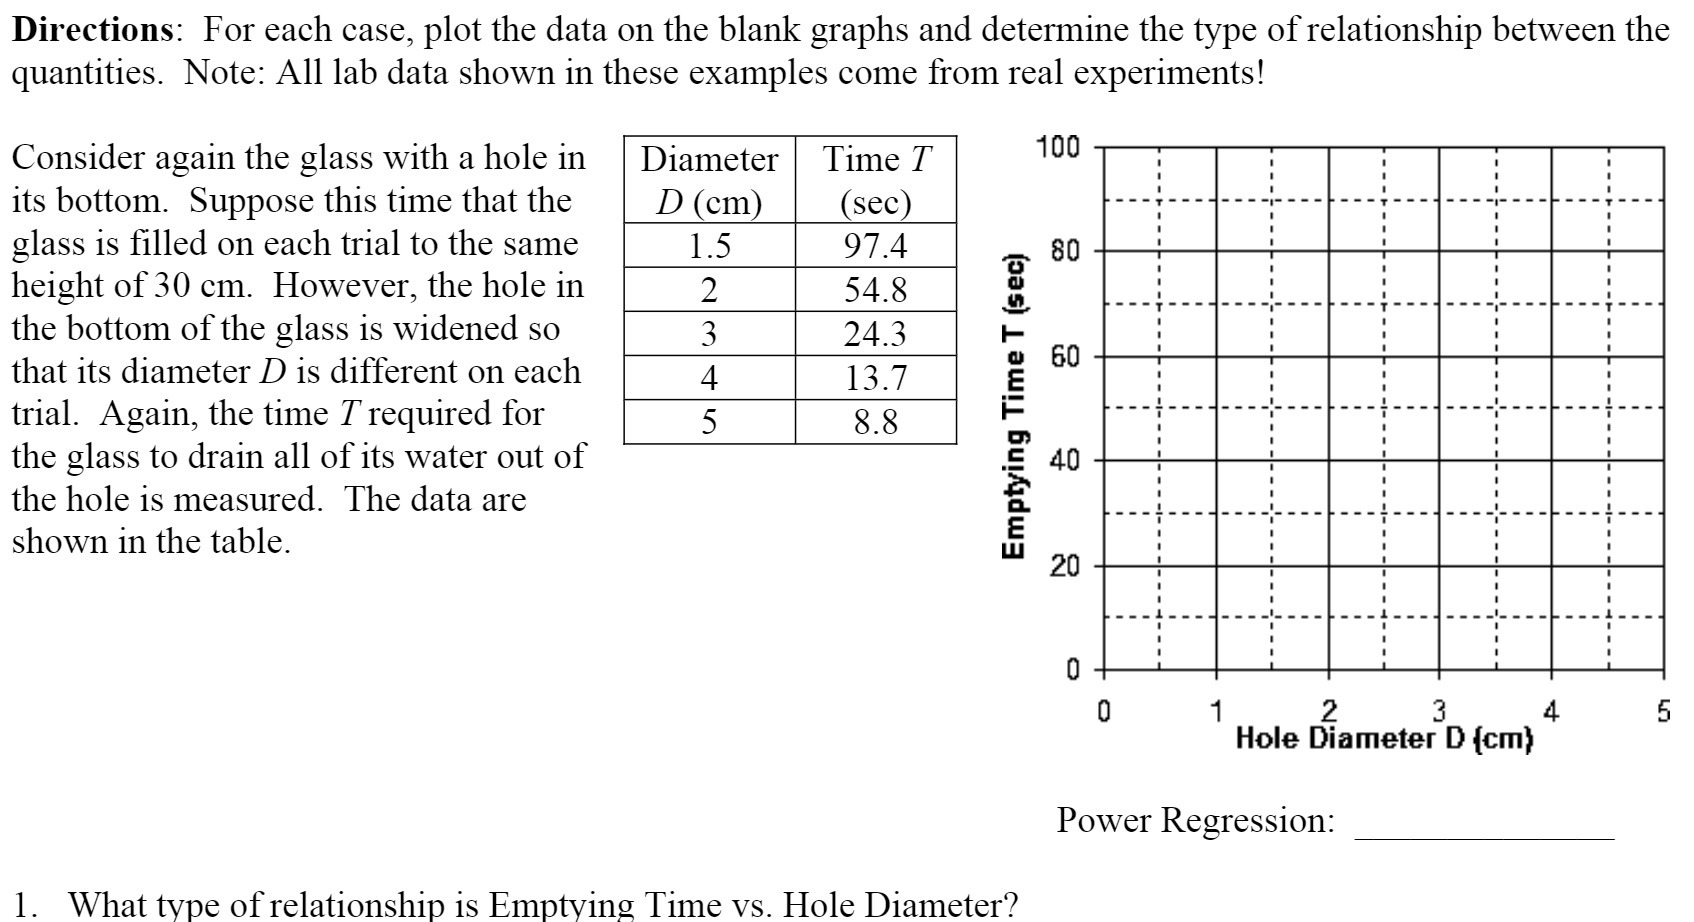
Directions: For each case, plot the data on the blank graphs and determine the type of relationship between the quantities. Note: All lab data shown in these examples come from real experiments! Consider again the glass with a hole in Diameter Time T 100 its bottom. Suppose this time that the D (cm) (sec) glass is lled on each trial to the same ._. 30 height of 30 cm. However, the hole in i the bottom of the glass is widened so _3 _24_3 | that its diameter D is different on each E 60 trial. Again, the time T required for l: the glass to drain all of its water out of .E 40 the hole is measured. The data are E shown in the table. E 20 I] E] 1 2 3 4 5 Hole Diameter D {cm} Power Regression: 1. What type of relationship is Emptving Time vs. Hole Diameter
Step by Step Solution
There are 3 Steps involved in it

Get step-by-step solutions from verified subject matter experts