

Question: Directions. Give what is being asked. A research study was conducted by a Grade 10 researcher to examine the differences between Grade 9 and Grade
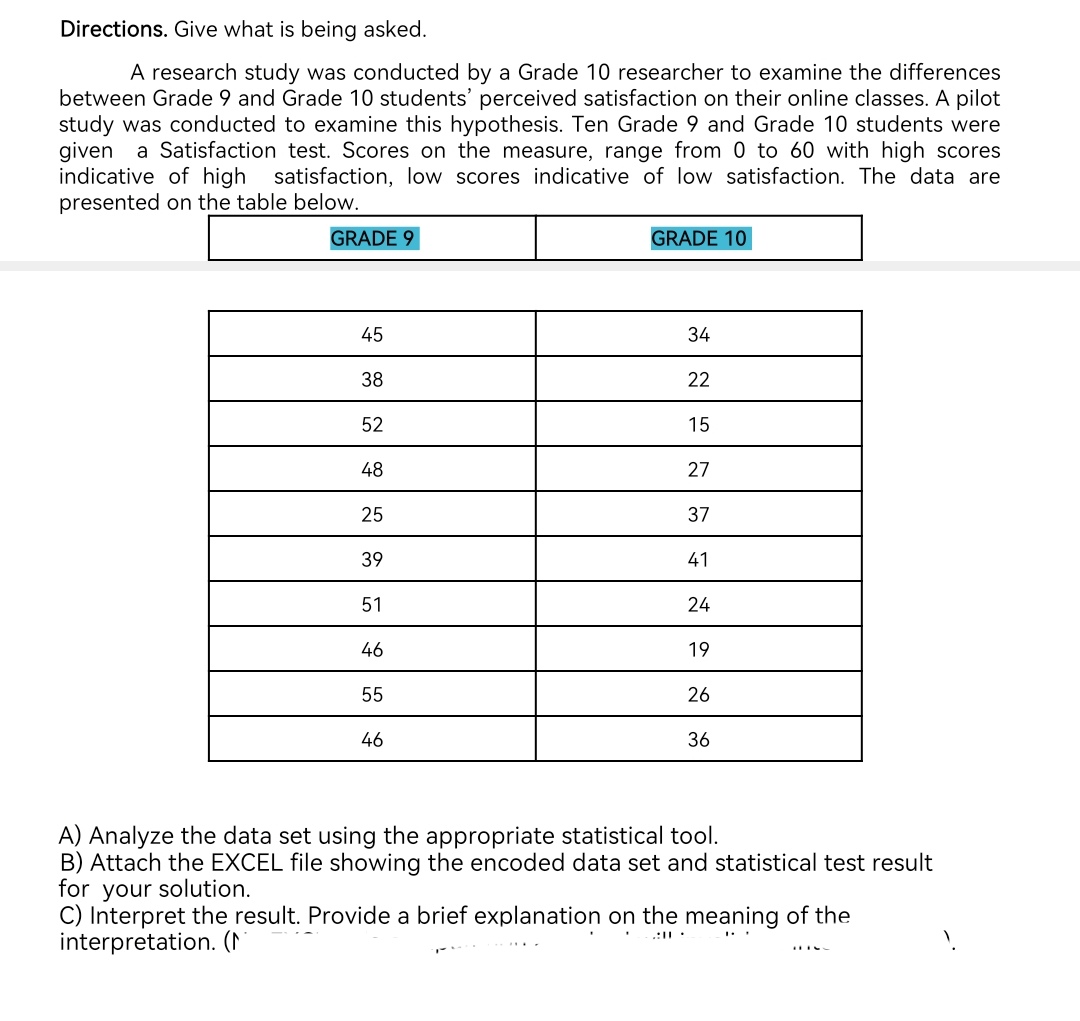
Directions. Give what is being asked. A research study was conducted by a Grade 10 researcher to examine the differences between Grade 9 and Grade 10 students' perceived satisfaction on their online classes. A pilot study was conducted to examine this hypothesis. Ten Grade 9 and Grade 10 students were given a Satisfaction test. Scores on the measure, range from 0 to 60 with high scores indicative of high satisfaction, low scores indicative of low satisfaction. The data are presented on the table below. :3 A) Analyze the data set using the appropriate statistical tool. B) Attach the EXCEL file showing the encoded data set and statistical test result for your solution. C) Interpret the result. Provide a brief explanation on the meaning of the interpretation. 0" " _ ' ' .m - -- *
Step by Step Solution
There are 3 Steps involved in it

Get step-by-step solutions from verified subject matter experts