

Question: Directions: Please complete the following statistical analyses for a quantitative data set that you collect. How you choose to collect the data is up to
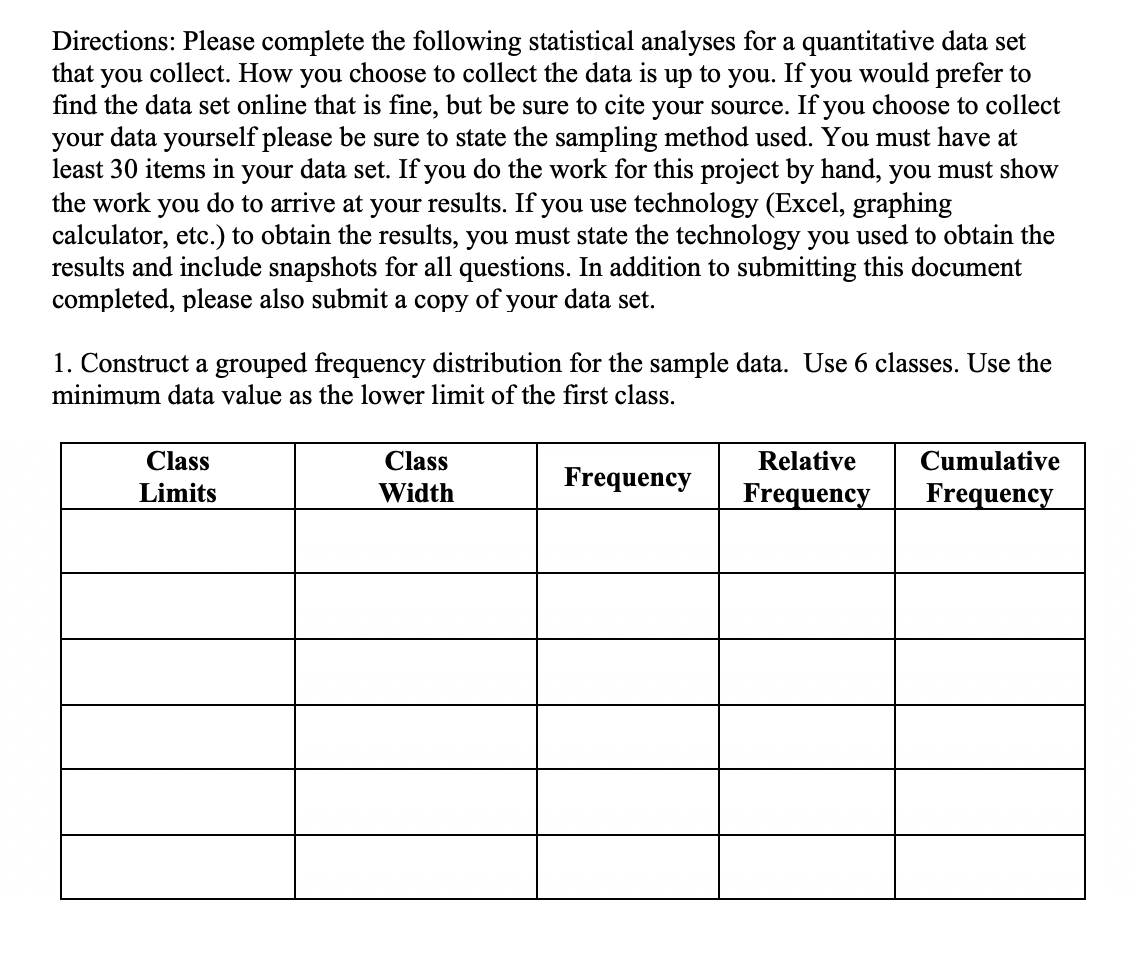


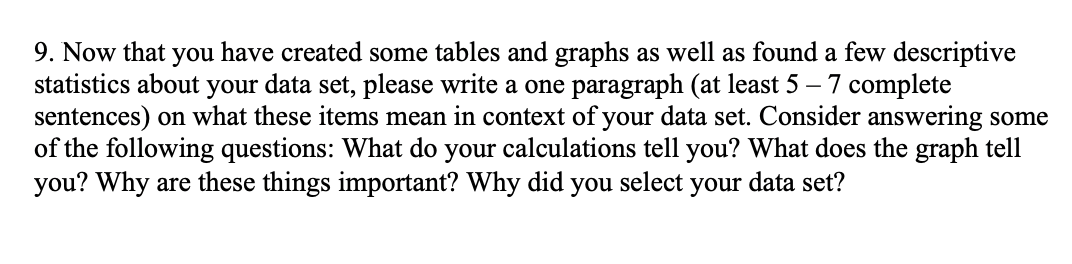
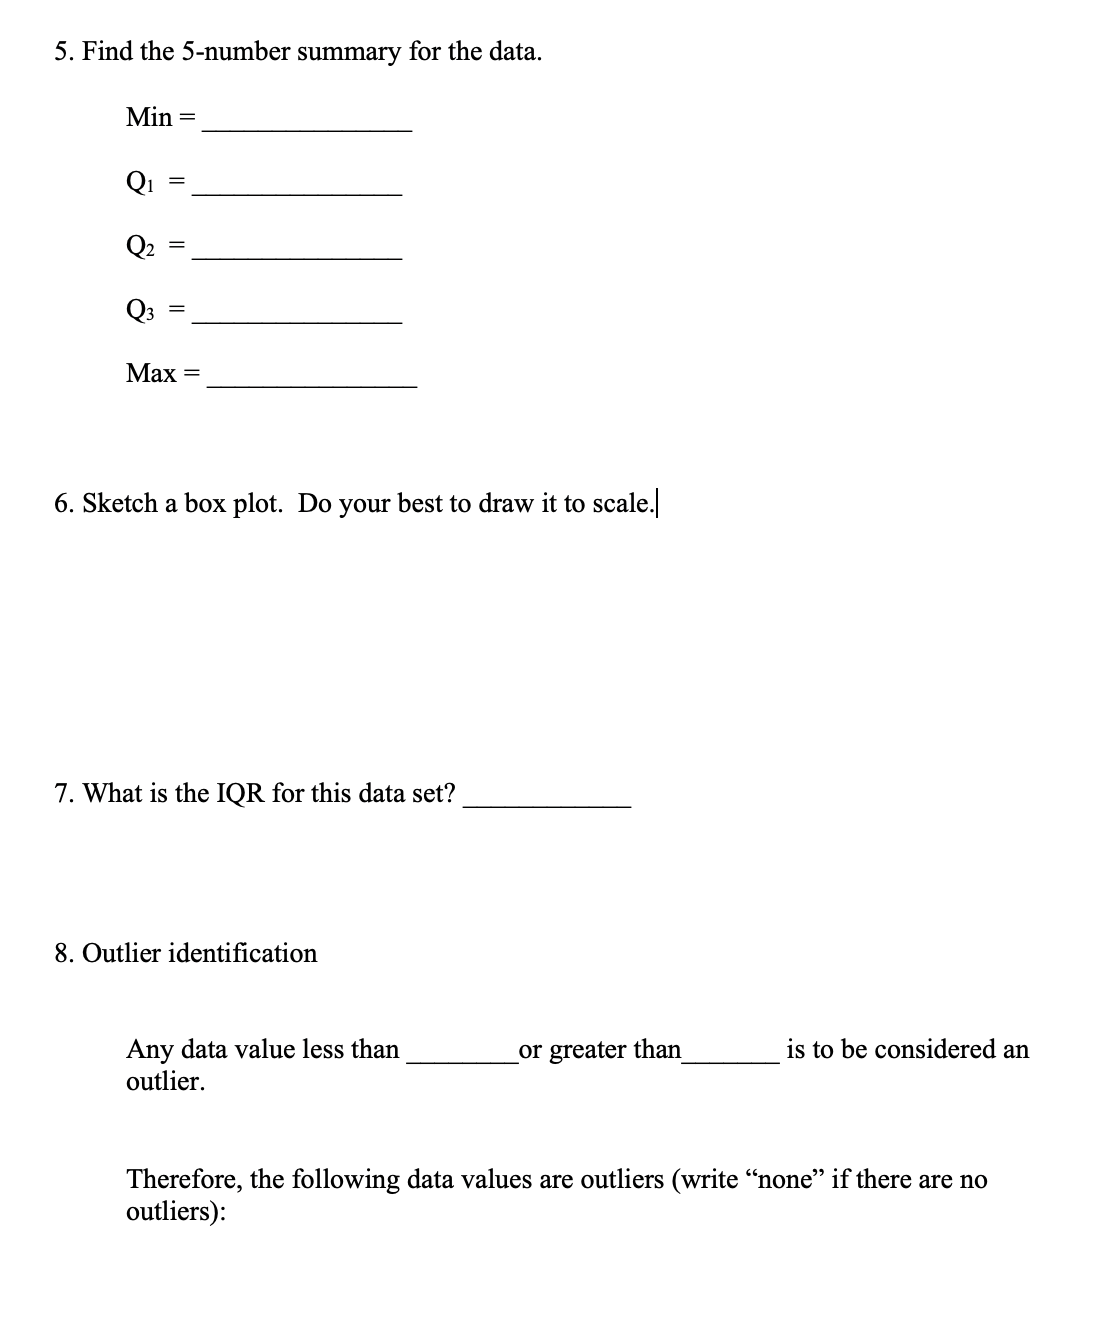

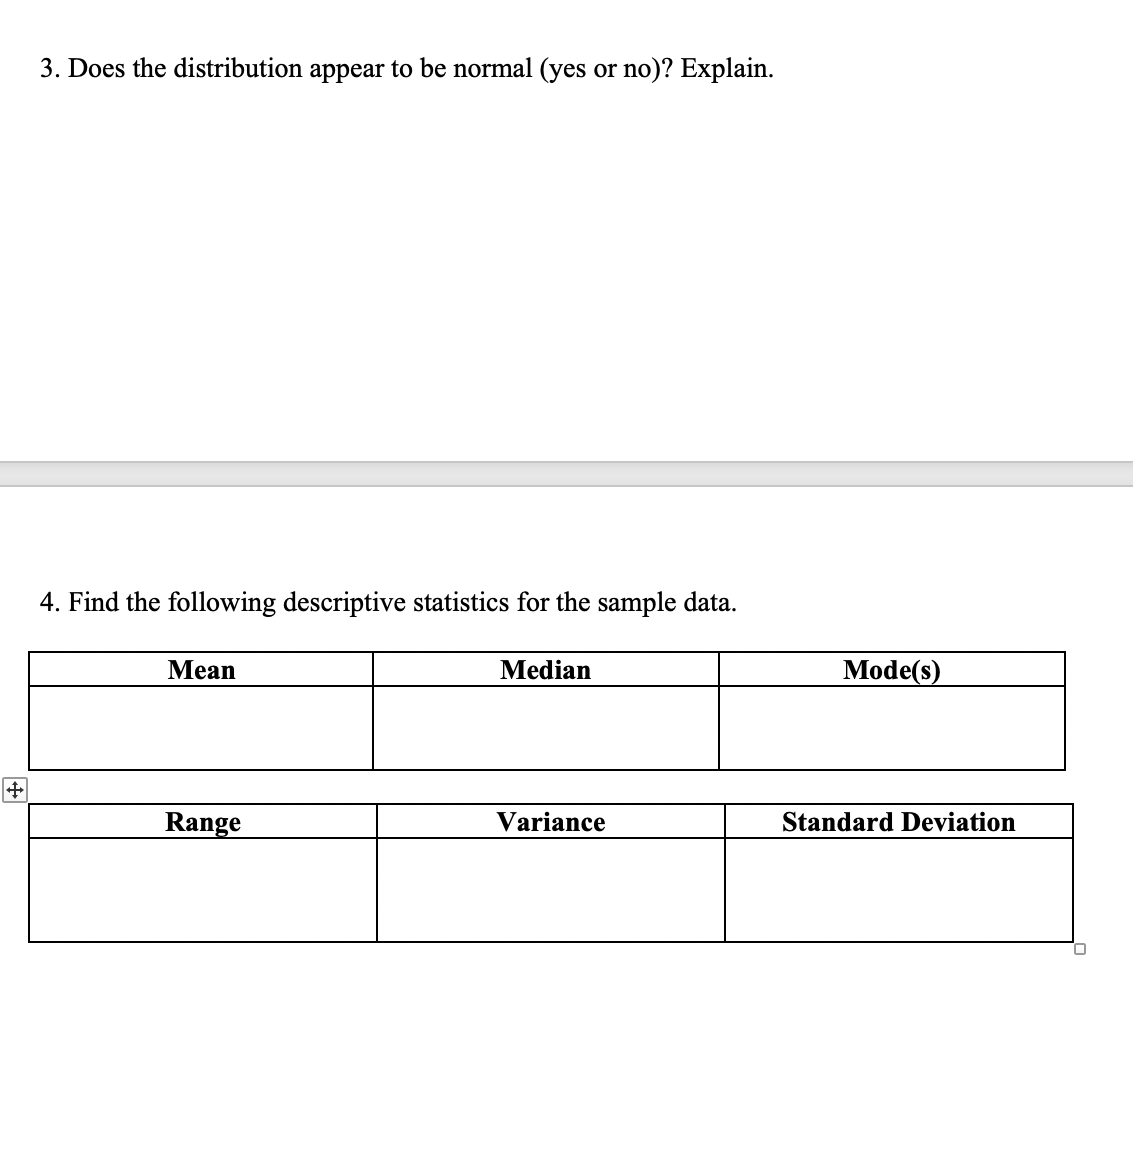


Directions: Please complete the following statistical analyses for a quantitative data set that you collect. How you choose to collect the data is up to you. If you would prefer to find the data set online that is fine, but be sure to cite your source. If you choose to collect your data yourself please be sure to state the sampling method used. You must have at least 30 items in your data set. If you do the work for this project by hand, you must show the work you do to arrive at your results. If you use technology (Excel, graphing calculator, etc.) to obtain the results, you must state the technology you used to obtain the results and include snapshots for all questions. In addition to submitting this document completed, please also submit a copy of your data set. 1. Construct a grouped frequency distribution for the sample data. Use 6 classes. Use the minimum data value as the lower limit of the first class. Class Class Relative Cumulative Limits Width Frequency Frequency Frequency3. Does the distribution appear to be normal (yes or no)? Explain. 4. Find the following descriptive statistics for the sample data. 2. [Draw a histogram for the data set. Title the graph and label the axes appropriately. 9. Now that you have created some tables and graphs as well as found a few descriptive statistics about your data set, please write a one paragraph (at least 5 '7 complete sentences) on what these items mean in context of your data set. Consider answering some of the following questions: What do your calculations tell you? What does the graph tell you? Why are these things important? Why did you select your data set? 5. Find the 5-number summary for the data. Min = Q1 = Q2 = Q3 = Max = 6. Sketch a box plot. Do your best to draw it to scale.| 7. What is the IQR for this data set? 8. Outlier identification Any data value less than or greater than is to be considered an outlier. Therefore, the following data values are outliers (write "none" if there are no outliers)
Step by Step Solution
There are 3 Steps involved in it

Get step-by-step solutions from verified subject matter experts